The PROCESS Report provides a summary of the processing resources being consumed on the host machine (the PC that is running the SNIP NTRIP Caster). It can be used a means to track daily and weekly resource consumption on busy Casters.
It is also helpful when debugging remote Casters running on Virtual Machines (VMs), providing a variety of configuration details. It is generally only of interest to the SNIP operator or our support staff. This report is not available on the Lite models of SNIP.
Aside: In the Rev3 release of SNIP this report (and others) will use a secure SSL/TSL
link to prevent any unauthorized parties from requesting it.
The general look and feel of the report is very similar to other reports. The precise content and format changes with the options being run on the SNIP machine. A typical report is below.
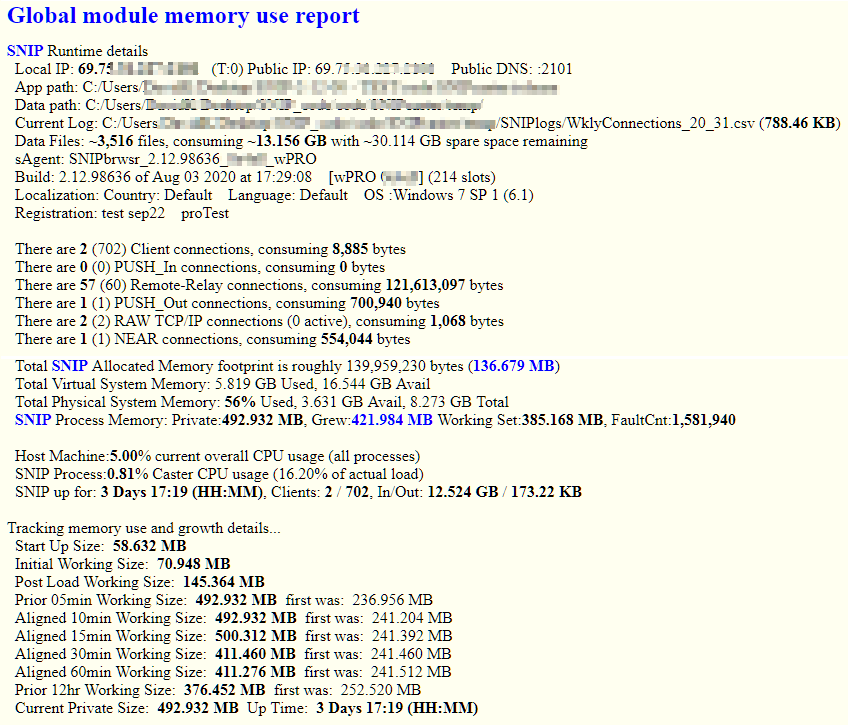
After the Process Report, an Uptime Report is appended as well.
Requesting the Report
This report can be obtained in several ways as shown in the table below.
| Web Command: | /SNIP::PROCESS |
| Doc Command: | A button labeled Process is shown on machines with this ability. |
| SNIP Window: | Menu: Reports -> Network Traffic -> Resources Report |
| Details: | This report can be disabled with the Preferences dialog. |
NOTE: This report can be requested over the web by other parties and this may be a security concern for some installations.
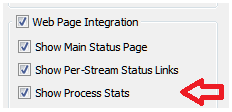
The SNIP operator can disable this report using the Preferences Dialog (menu Edit → Preferences) and simply unchecking the checkbox labeled “Show Process Stats.”