Users have recently asked about the differences between the Lat-Long location found in the Caster Table and that found in the message streams, the RTCM 1005,1006,1007 messages types. This is perhaps driven by the the simple map feature that was first added in SNIP Revision 1.0.0 which is modeled on similar graphical displays found in many NTRIP Clients.
This article serves to describe how each of these location values are used in the typical RTK system, and by SNIP.
First and foremost, the location shown in the caster table for each mountPt is only advisory – it is not actually used in RTK or PPP navigation. Bad data here will not harm a rover’s ability to position in any way. Still, one should set it correctly. Its intended use is only to assist the NTRIP Client (the rover device) to determine what stream it wants. Quite often there are errors found in the data published by others. That is why some places in North America get the sign wrong (Hint to my fellow Americans: we live to the West of the prime meridian, so all our Longitude values are negative (see Note A below)). And many systems with virtual reference stations (VRS), or even simple nearest site connection systems, will leave the value in the caster table entry blank. I.e. 0,0 – and that is why you often see reference stations claiming to be in the ocean south of Ghana. [See this article about zero, zero locations in caster tables for further details]
By definition, the caster table entry has only two digits of precision and is in degrees (the form: DD.dd). By contrast (and also by definition) the ECEF values used in the actual RTCM messages is accurate to 0.0001 meters (expressed in ECEF values in the form: XYZ in meters). So if you plot both on the same map you will notice some differences, such as the two locations shown below.
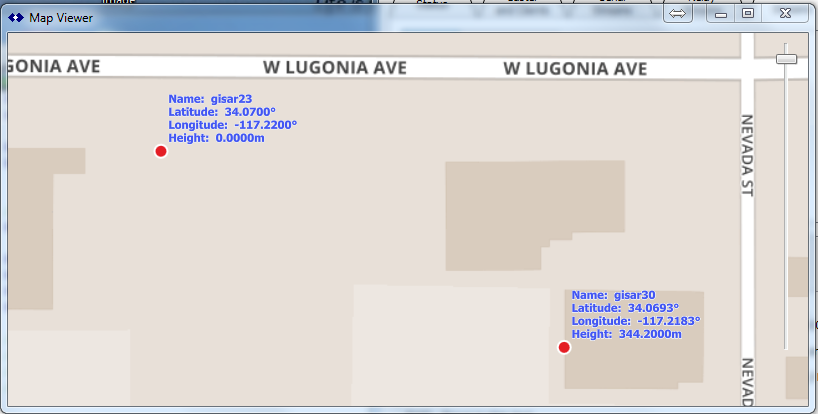
The site called “gisar23” is sending messages in the RTCXM2.3 format (which SNIP does not decode at this time), while the site “gisar30” is sending messages in the RTCM3 formats (with SNIP has decoded and has extracted the more precise location). These come from the same antenna and therefore the exact same location, one is plotted using the rough caster table data, the other the precise ECEF data of the message stream. You can see from the base map that “gisar30” is located alongside the edge of a building wall. This is a site local to our offices (~50km) and is run by the GIS firm ESRI. [We often use it for longer range baseline L1-only testing.] In this image the rounding caused by the less precise data in the caster table is clear to see.
A simple hint to detect which source was used in a map (this is often true for similar maps created by other tools as well) is to look closely the height above the ellipsoid (if shown). A caster table entry does not provide this value (so it is always shown as zero), but any EFEC value converted the LLH will. The rounding is also a clue.
How SNIP Locates a Base Station
Further details about SNIP. The SNIP process of determining where a reference station is located is as follows.
- First, SNIP starts the caster stream up and enable data servicing as quickly as possible (starting with a dummy placeholder caster entry).
- Second, it uses the caster data provided by the sender/source once a caster table has been loaded (accuracy unknown, precision ~500 meters)
- Third, any time SNIP can decode a more accurate position from the data stream itself (and it will also validate what the caster table entries say), it will replace the original data in the caster with the verified data and use it in further map displays. (precision 0.1 mm)
- The “city” and country entries in the caster table are also completed, if they are empty, during this process. The IP from which the data originates is used for this. The county code will be accurate but the city code often is only accurate to nearest larger city. SNIP indicates this by adding the text “Is near” as in “Is near London” as the string.
This process is automatic, but takes about 130 seconds to complete based on how fast the caster table is sent and how often a reference station position message is sent by the stream.
The reported Locations vs the Least Squares Location
When SNIP uses the built in navigation filters to present a graphical view of a Base Station, the resulting plot is only a simple least square estimate of position. No RTK methods are used, and the ionospheric model is primitive. Hence, the reported and plotted location is near, but not overlapping, with the actual surveyed location. It is typically offset by a under 2 meters.
You can enable this display by right clicking on a slot and selecting the Graphical Views menu item. When the navigation plots are running, select the Map button to display a map. The map will be centered on the positional estimate, with the report ECEF location from the Caster table or the RTCM3 message stream shown nearby.
Note A; The above incorrectly read East for nearly 3 years. Many thanks to Bob Darby for pointing this error out to us.