This article demonstrates detailed debugging using SNIP’s RTCM3 Decoder dialog to determine the general quality of the observation messages present in a given connection stream.
Background
A common issue when a given correction stream and a target rover which then fails to achieve rapid ambiguity resolution (AR) into a fixed state is to first examine the quality of the input data of both sides. Two immediate culprits are lower than expected SNR / Cno values and the presence of carrier cycle slips (both detected and undetected). These are most often rover side problems due to localized sky blockages, but it’s always good to reconfirm the caster is sending good data to compare with. While a full treatment of this topic beyond the scope of such a knowledge base, here we demonstrate how SNIP’s tools can be used to classify the data involved.
The primary tool to use here is SNIP’s RTCM3 Decoder dialog to look over the observation data messages:
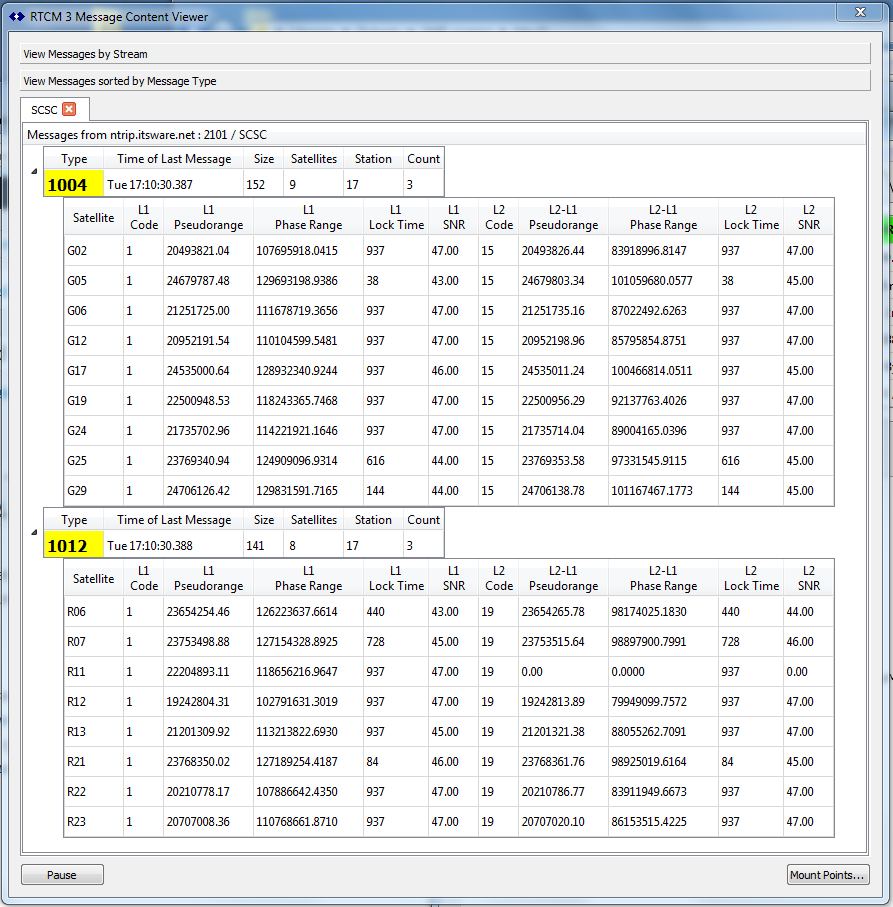 The RTCM3 Decoder Dialog, showing typical content from the GPS 1004 and GLO 1012 messages
Understanding the Lock Time Element
The L1 and L2 Lock Time elements provide a logarithmic scale of how long it has been since the last loss of lock event was detected by the sender. The display is in units of seconds, but the actual transmitted value is a 7 bit logarithmically encoded field where the first 24 seconds are at a 1 second precision, then a 2 second precision, etc. The value 1 indicates a loss of lock one second ago, while 937 seconds (the largest value) indicates that the last loss event was over 15 minutes ago. On a loss of lock events the value tumbles to zero and slowly rebuilds.
Different navigation filters will use this information in differing ways. Most will not “trust” or use a signal that has just slipped in an RTK style filter for some brief period of time. You will observe that as all SVs reach the local horizon (and any other path which then becomes occluded) that cycle slip events occur more frequently until total signal loss ensues.
The above shows that GPS SV G05 lost lock 38 seconds ago on both its L1 and L2 carriers. Before that point in time, G29 had a loss of lock event 144 seconds ago. On the GLONASS system, R21 experienced a loss 84 seconds before. While the above happens to show the same values for L1 and L2, it is typical for L2 to fade more quickly due to its lower effective transmission power. A local sky plot can be used to further confirm that any such SVs are near the horizon.
Understanding the SNR Element
The L1 andL2 SNR elements represent the sender’s estimate of his SNR (in fact the device’s estimated carrier to noise ratio over a one Hz space) averaged over the most recent measurement epoch. For a reference station this typically means for one second, or 1024 correlation intervals. For a rover the integration period used and reported varies widely. The values are expressed in units of 0.25db up to more than 60+ dB. The value zero indicates that the data is not available. A good reference station installation should be able to hold values in the mid 40dB range of above with SV above the local horizon.
For the most part, more is SNR better and above 40dB is good enough. But few receivers are as sensitive as the the low cost uBlox devices. Often marginal power levels can result in notably increased positional variance (large covariance residuals) in less sensitive devices. In the above data the weakest signal, from G05 at 43dB, is still fairly strong, but it is interesting (and typical) to see that this is also the SV with the most recent cycle slip event.