The IP Most-Used Report provides a current sorted list of which IPs have most frequently connected to your SNIP Caster. It is used to quickly see which IPs are connecting most often (perhaps due to various connection problems that need to be dealt with).
The report shows the source connection IP, the user name for the account, the MountPt name of the Base Station involved, and other key details. It is sorted from the most frequent to the least. It displays the first 80% of all connections. This threshold value has proven to provide sufficient summary data. [Hint: If you want to see EVERY connection that has occurred with EVERY IP, use the IP Address Report.] Some statistical information is also provided in the header.
Connections from Base Stations that connect to the Caster using Remote-Relay, PUSH_In, and Raw TCP/IP stream types can also appear in this list when the IP connection is unreliable and prone to frequent restarting.
Clicking on the hyper link for any IP brings up a report of all the different connection that have occurred for that single IP as well the NTRIP agent(s) used, connection lengths etc. See this article for details.
A typical report from a busy Caster is shown below (click to enlarge):
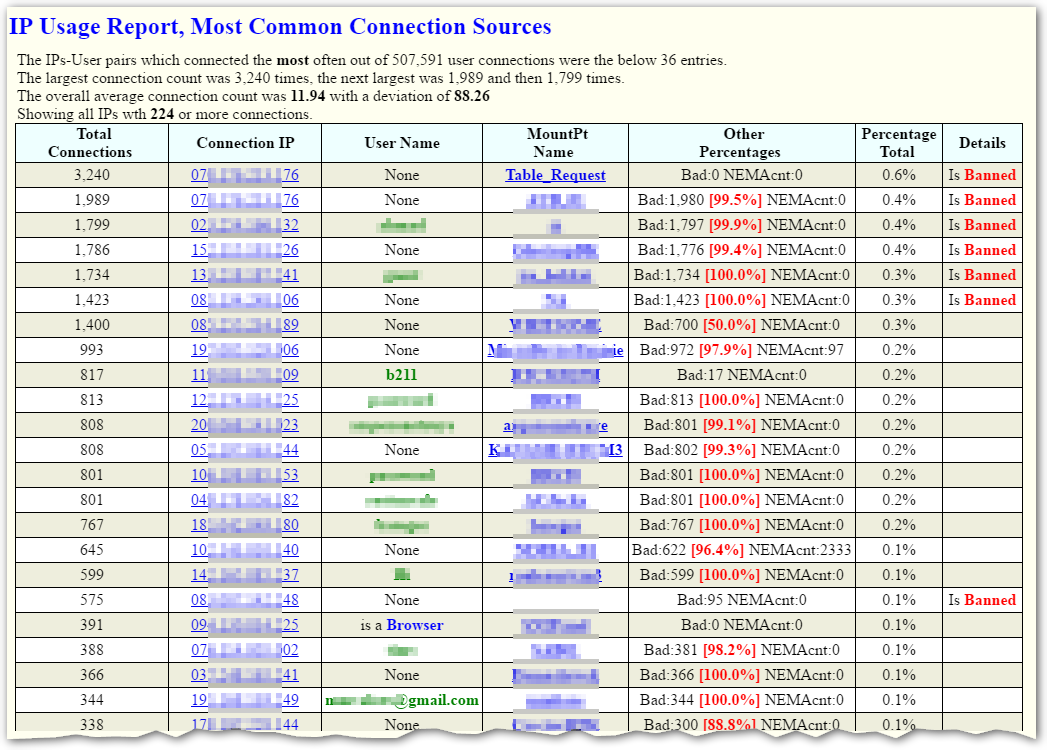
Examining this report further, one can see that the first two entries (from the same IP) constitute 5,220 bad connections (~10% of the machines overall connections). And as noted along the right side, that specific IP and several others have been blocked for various periods of time (the IP Blocked Report would provide further details for each). The vast majority of the other entries consist of NTRIP Client Devices that are either ill-configured or are seeking for a mountPt that is not present in the Caster when they requested it. Clicking on the IP would provided additional details. One entry shows a Browser which has connected 391 times! In such cases SNIP returns either a Caster table or general status report (depending on how the operator has configured the Caster). If the browser had issued a SNIP command, that would have been shown.
Requesting the Report
This report can be obtained in several ways as shown in the table below.
| Web Command: | None |
| Doc Command: | None |
| SNIP Window: | Menu: Reports -> Network Traffic -> IP Usage Report |
| Details: | This report is only available to the SNIP operator. |
This report cannot be requested over the web for security reasons.