This article provides a quick review of several Stream Reports that the SNIP NTRIP Caster provides and their general usage. These reports can be printed or sent to others by way of the eMail service.
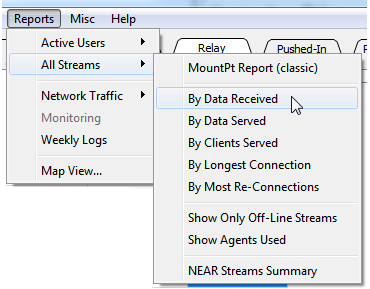
These are all invoked by using the Reports menu, and the All Streams sub-menu. And each item displays its report in the document viewer window.
The content and presentation varies based on the selected sorting criteria. In general, these sorted reports are of most value to the SNIP operator with several hundred streams and/or connections that need periodic monitoring. SNIP‘s extensive hypertext linking allows moving between other related reports in the document viewer.
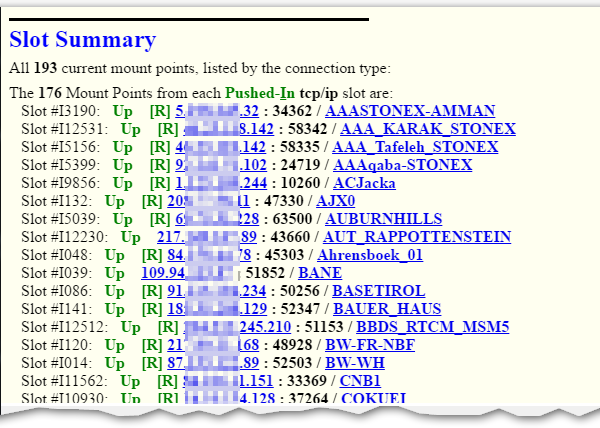
MountPt Report
This report provides the now classic mountPt summary listing with the general status of each Base Station stream, its unique slot assignment, reservation status, IP details, and up/down state. Unlike the “List MountPts” button found on several of the tabs, selecting this using the menu will result in the report being placed into a new tab in the document viewer (rather than the log console).
Sort By….
Several of the reports provide a way to sort the report content by various metrics.
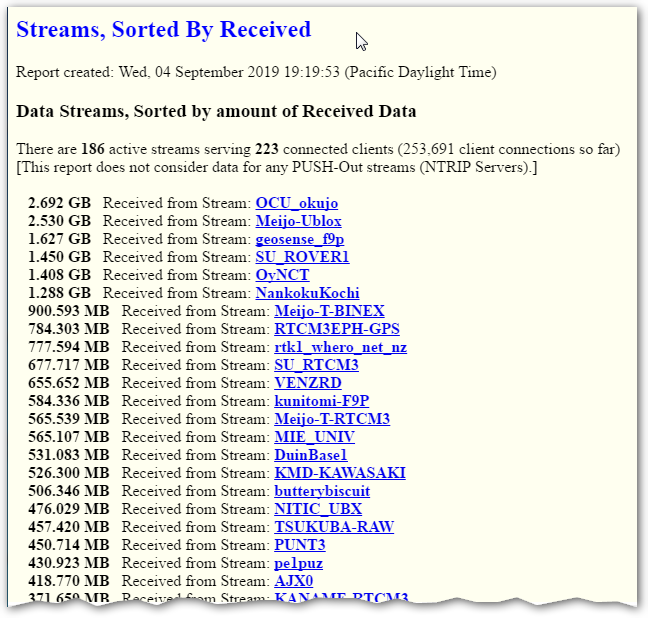
Data Received
This report provides a summary of which data streams (Base Station connections) have received the most in-bound data. Excessively large values often indicate that a stream has non-RTCM clutter or unwanted messages as part of the message payload (which should be removed at the source or PFAT Filtering can be used). It can also indicate that observational data is being sent at a rate higher than 1Hz, which SNIP fully supports, but which is of little practical value.
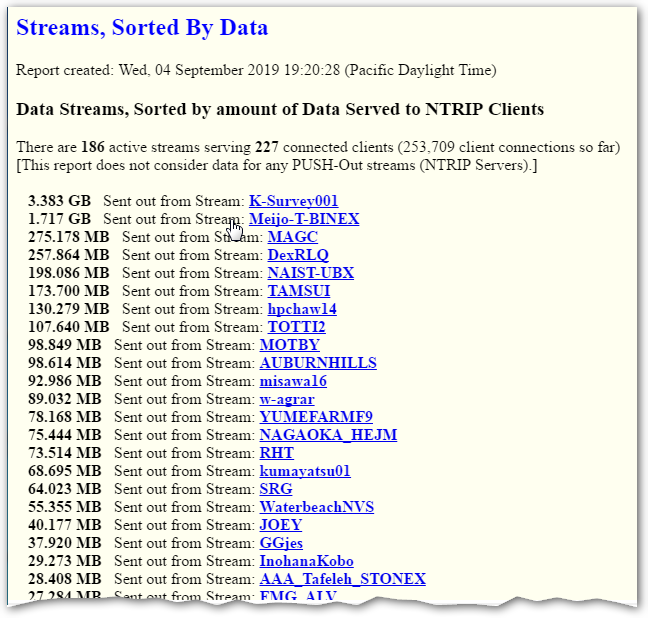
Data Served
This report provides a summary of the total data served out to the connected NTRIP Clients for each stream. The values grow in proportion to the number of connected users as well as the amount of data available and the length of time that data streams have been present. Hint: You can also use the weekly log menu item to display the amount of data served out over time. This can be used to detect trends such as a Station not being used during the weekends.
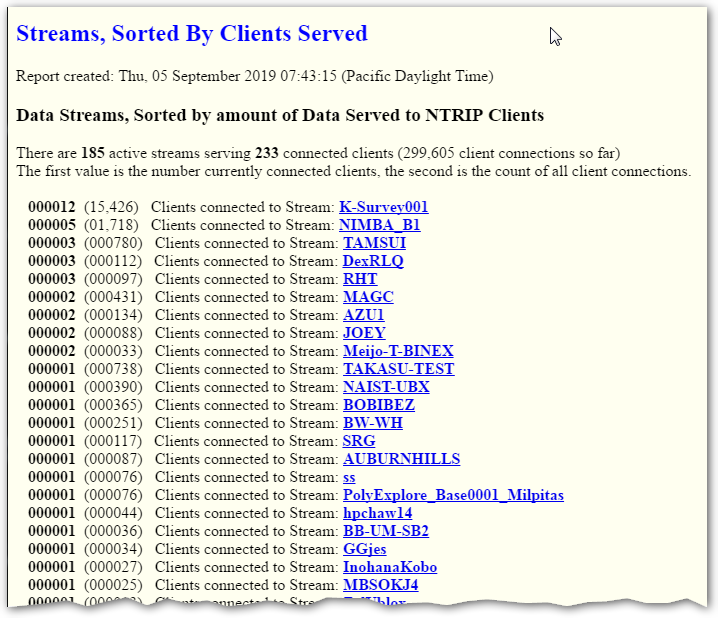
Clients Served
This report provides a summary of the total connected clients for each stream when it is requested. The number shown in parentheses is the total number of client connections each stream has serviced since it was started. Depending on how you have set up your SNIP node, these connections may come from the same user account or from multiple accounts. Hint: The Show Current Users dialog can be used to see more details about each individual connection (available as a menu item and as a button on the Caster and Clients tab).
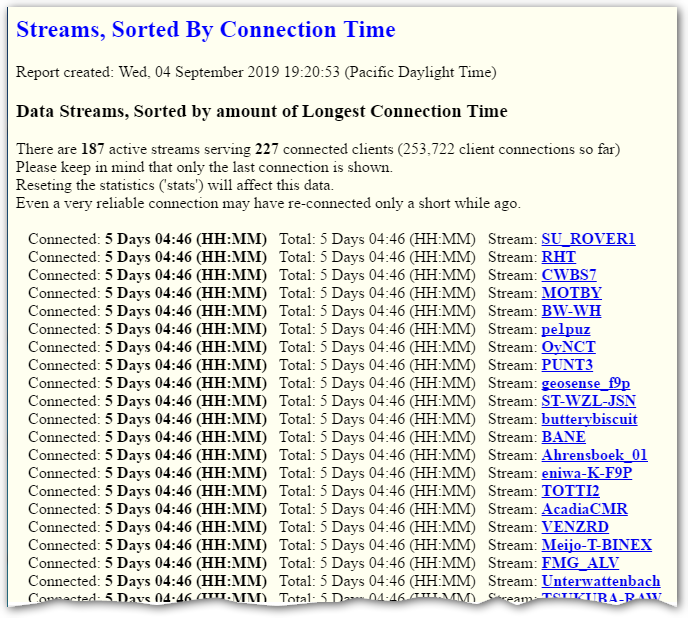
Longest Connection
This report provides a summary of which streams have been connected for the longest period of time.
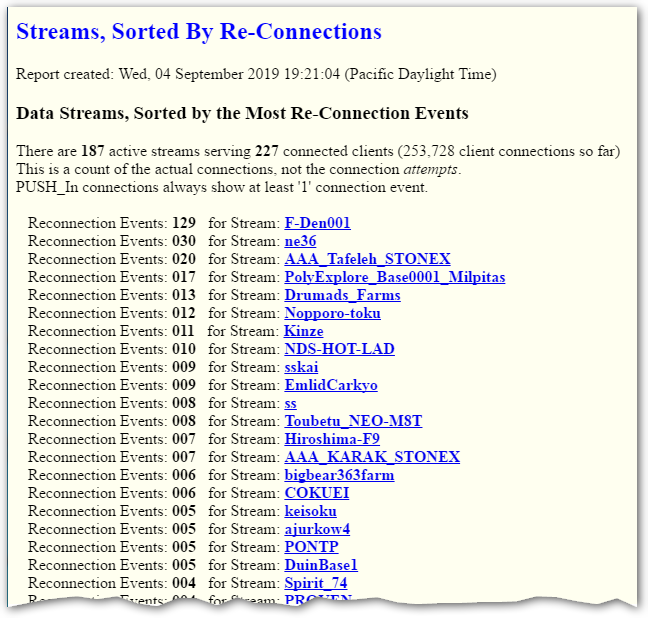
Most Re-connections
This report provides a summary of which streams are re-connecting the most. In general, many re-connection events indicate a stream or connection that is unable to sustain use as a Base Station and the root cause should be investigated and corrected. Hint: You can also use the weekly log menu item to display such drop out events graphically over a longer period of time.
Show…
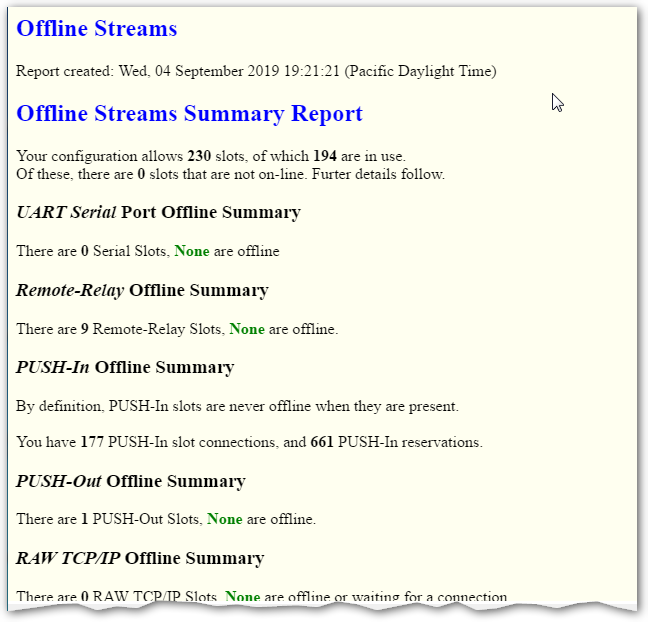
Only Off-Line
This report provides a quick summary of any data streams that are off-line or otherwise unable to connect and send data. Such streams may require additional attention or action to be brought back on-line. If no off-line streams are found, the report summarizes this. The report is ordered by each stream type.
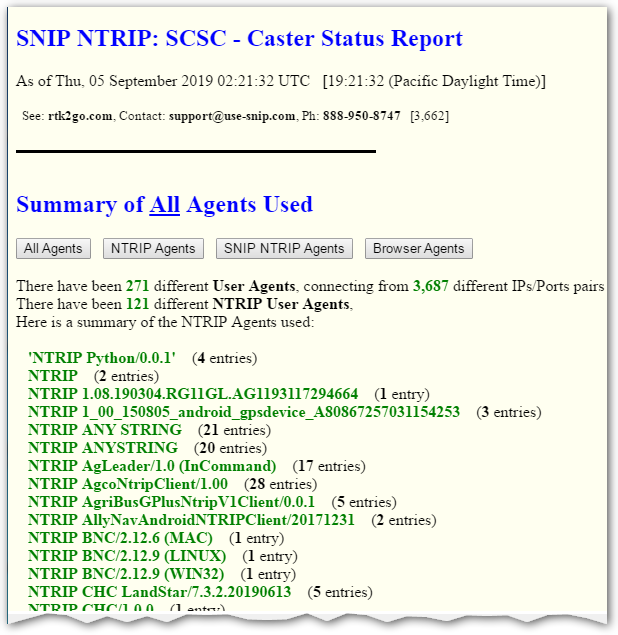
Agents Used
This report provides a summary of the NTRIP connection agents seen (as well any agent used by common browsers that have connected to your copy of SNIP). Within the report, the content can be further filtered by the type of agent. Well-formed NTRIP software products provide a unique agent string when connecting, but many low end and open source projects do not (four such agents can be seen in the below).
NEAR Stream Summary
The report provides a summary of every NEAR stream that is set up when it is run. The summary includes a listing of the Base Stations which form the “pool” used by the NEAR stream as well as other setup details.
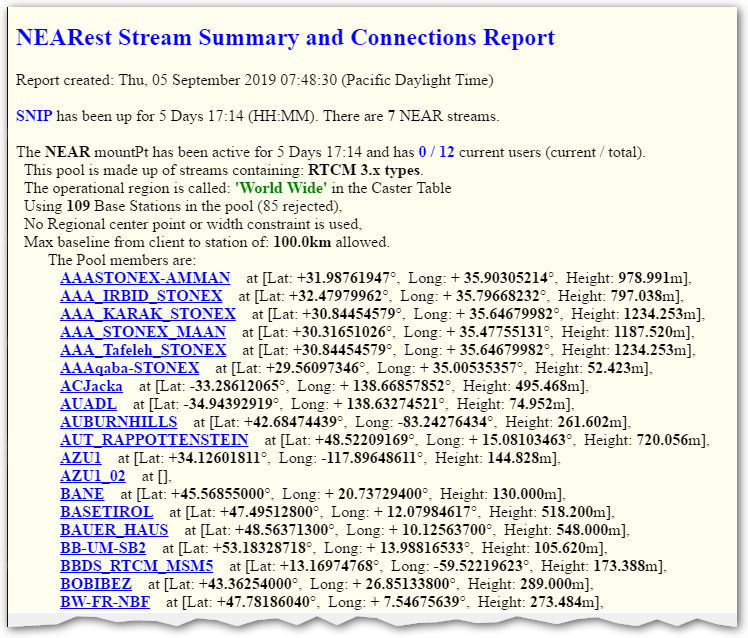
Note: The report images used above were taken from the RTK2go.com node on Sept 5th 2019,
RTK2go is free public open NTRIP Caster service run by SCSC.