Graphical Monitoring
There is often a common need to use the data streams to perform a basic navigation filter in order to provide visual feedback regarding the stream data. Often advanced users will use 3rd party tools to monitor specific details of the data signals, simply connecting to their own streams like any other NTRIP client.
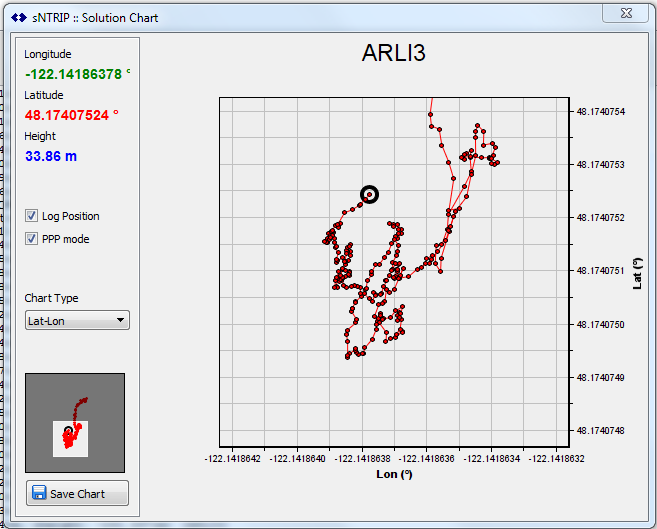
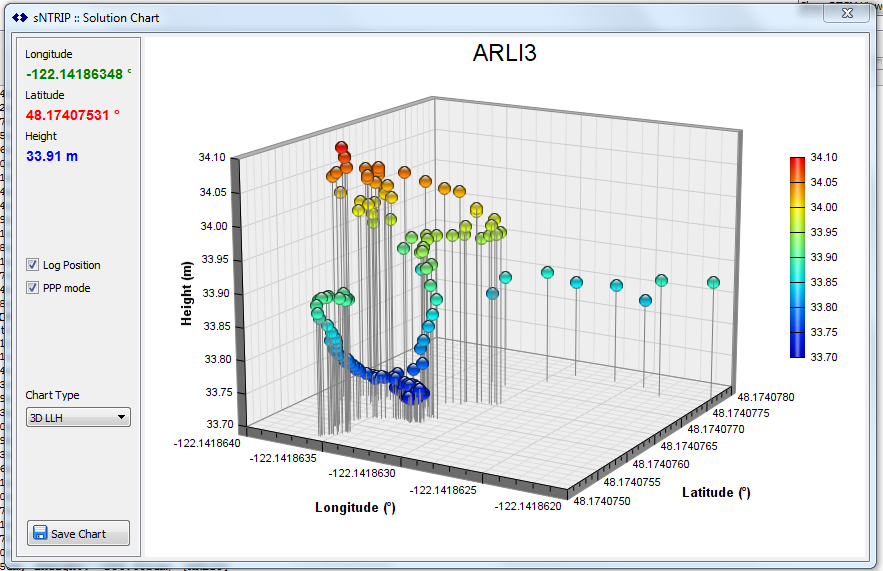
SNIP provides some basic navigation filters and plotting tools to enable this ability under the “Graphical Views” menu item. You can, as an example, use the observations from one stream, and the corrections from another, while using the ephemeris from a third, to perform RTK solutions on your streams. This tool provides a visual insight into the real time performance of the selected data streams. The command is available under the right-click pop-up menu for each slot.
Here are few simple examples (click for larger images)
For a list of the various graphical Navigation Plots styles which SNIP supports, see this article.
See also this article on Message Monitoring for details of how to decode and display individual RTCM message contents.
Hint: For the small operator, the Lite version of SNIP (which is free) provides for up to three streams. These can be used to provide an end to end check of your data. Use one one stream to connect to your GNSS device, another to PUSH-Out the data to a public caster (such as RTK2go.com) and use the final 3rd stream to connect to that public caster as a normal NTRIP Client to see your own data returned to you.