SNIP supports two basic navigation filters along with various charts which can be used to display the resulting solutions. The displayed charts are responsive to mouse-over tracking, providing additional data details as the mouse hovers over each data point. A simple least squares type filter, and a basic PPP style filter are implemented. Solution data is kept for the prior 15 minute interval (the last 900 epochs). Both filters use broadcast orbital data.
Hint: These charts are part of the navigation filter which is started by clicking the Graphical View command which is available under the right-click pop-up menu for any active data stream slot.
These are both “primitive” filters in that they can easily be used to validate that the data stream is performing as expected, but they should not be relied on to produce high accuracy positional estimates. Both use L1 only and do not include common ionosphere or clock corrections. Various 3rd party tools are better suited for that sort of need as well as other analysis. [Hint: If you want to use observed deviation from an RTK filter as a basic integrity monitoring method on streams in SNIP, use RTKLIB for your navigation filter, connecting it to the streams of interest.]
Note: These filters also depend on the presence of a remote relay stream called “RTCM3EPH” to provide Broadcast ephemeris data for their use (if the selected data stream does not provide orbital data directly). There are several freely available data sources that provide this data. Our open caster can also be used to obtain this data stream [use this mountPt: ntrip.itsware.net : 2101 / RTCM3EPH]. The SCSC provided data stream offers world-wide coverage of current Broadcast ephemeris for GPS, GLONASS, Beidou (the RTCM SC-104 experimental messages), and Galileo GNSS systems. As a best operating practice, we suggest that you always have this data stream present in your own SNIP installation.
These charts provide over a dozen common graphical views of the resulting navigation data for a single selected mountPt’s data stream. The basic types supported include:
- Lat-Long 2D Positional Plot
- Lat-Long-Height 3D Positional Plot
- Latitude vs Time
- Longitude vs Time
- Height vs Time
- Delta Lat-Long 2D Positional Plot
- Delta Lat-Long-Height 3D Positional Plot
- Delta Latitude vs Time
- Delta Longitude vs Time
- Delta Height vs Time
- Delta Combined Lat-Long-Height vs Time
- Delta Combined Lat-Long-Height – With An Average vs Time
- Number of SVs vs Time
- Fraction of Second vs Time
- Standard Deviations N-S, E-W, U-D vs Time
The user can change between these charts for each stream, but can select only one chart type at a time. Multiple streams can be displayed at once (unlike connections or decoders, this is not limited by the type of SNIP license). But on the whole this is discouraged by making the dialog remain in the foreground. The graphical aspects of charting are run in a lower priory thread, with most updates occurring at 1Hz. However, under heavy server loads, the chart image will not be updated until all caster clients are first served.
On Delta and on screen controls.
Many of the above charts have a “delta” and “non-delta” mode. Often the absolute value of a position is not of great interest to the base station operator; rather, the delta movement about such a point is the desired data. Most of the charts, therefore, are used with two modes of display. The average about which the delta is calculated is periodically recomputed as the data set evolves–typically every 30 seconds. It can be important to understand that the delta is expressed with respect to this average point and not with respect to the very last data point. Some charts (such as the number of SVs versus time of day) do not have a delta mode.
On the control widgets.
The control widgets shown on the left side panel vary with the three basic basic chart types. Charts that vary with time (linear charts) use the least widgets, and the span and pan of the data displayed can be controlled with mouse roller ball actions. Charts that relate two dimensions (XY scatter charts) have a small insert view of the entire data set shown at left. The user can drag the display in either view and use the roller ball actions for zooming. Charts that relate three dimensions (XYZ or LLH) can be adjusted with a small set of rotational widgets to control the view angle which is displayed. In all cases a “keep in view” check box causes the chart to rescale as needed to display the full data set.
On Point by Point movement
On most charts a label indicating the movement of the last point (in cm) is provided. This is presented as a 3D vector distance as well as decomposing it into its components of North-South, East-West, and Up-Down movement.
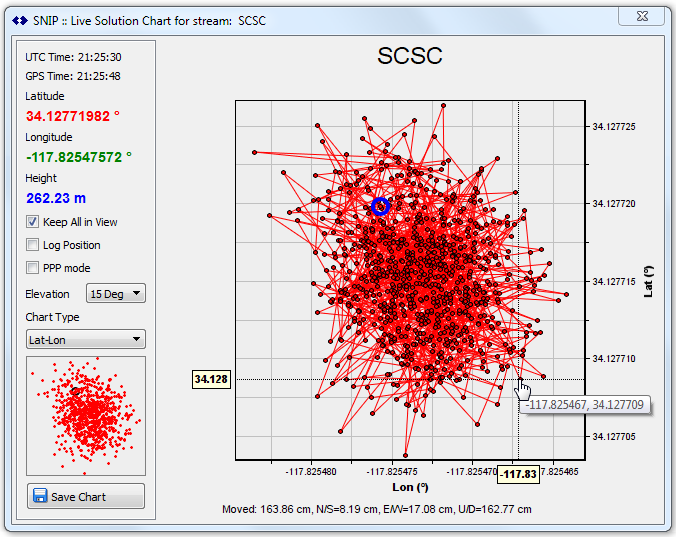
Lat-Long 2D Positional Plot
This chart displays the classical Latitude-Longitude scatter of positions about the provided base station’s location. Units of degrees are used. The most recent point is shown with a blue highlight. Like most of the chart types, hovering the mouse over any data point will result in a pop-up with additional data details, as is shown here.
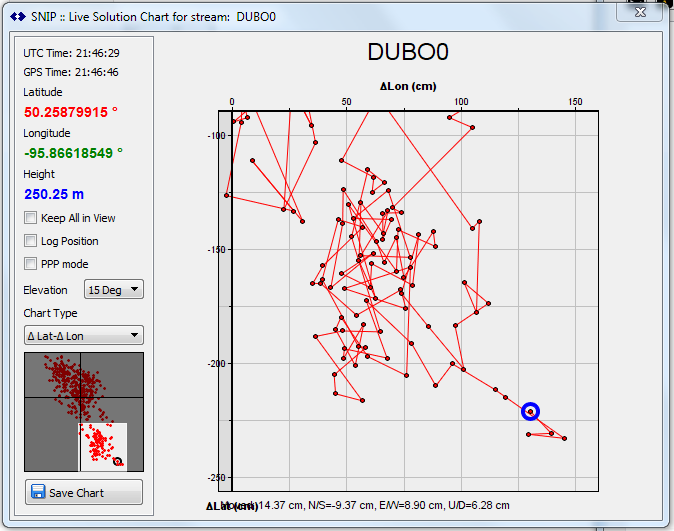
Delta Lat-Long 2D Positional Plot
This chart displays the classical delta X-Y scatter of positions clustered about the provided base station’s location. It represents the delta variant of the above chart. Units of centimeters are used. The average point used to represent zero is recomputed every 30 seconds. In this image one can see that zoom and pan controls have been used. The larger plot represents a portion of the lower right (south and east) quadrant about the current average position.
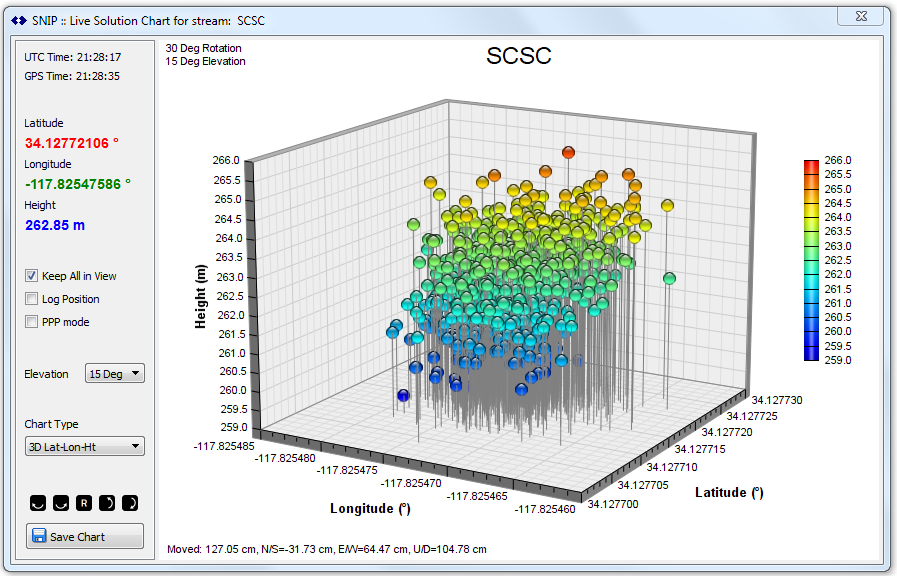
Lat-Long-Height 3D Positional Plot
This chart displays a three dimensional Latitude-Longitude-Height display of positions about the provided base station’s location. Units of degrees are used. The Height of each point is used to determine the color highlight used for that point. The viewing angle can be adjusted with the five rotational controls. The “R” (for reset) control resets the display to the starting rotation. The current viewing angle is displayed in the upper left corner.
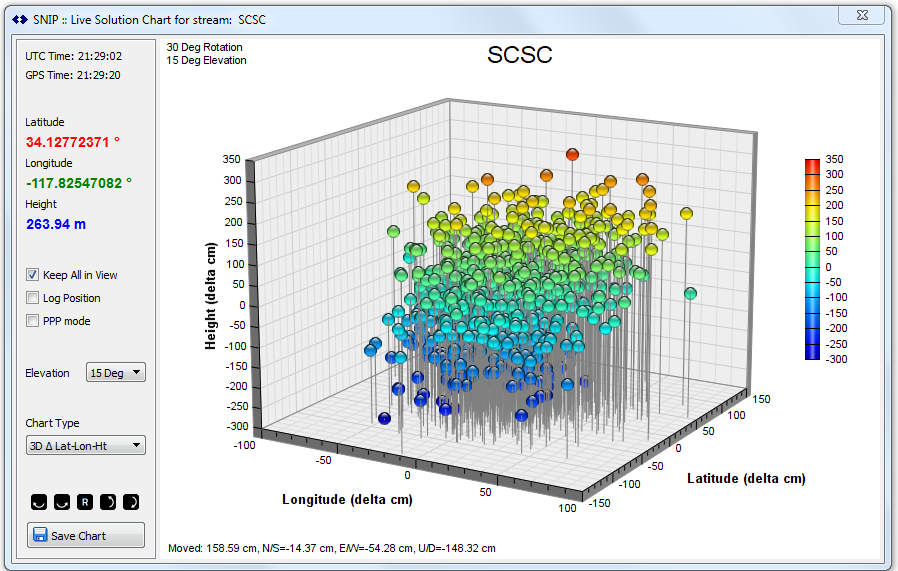
Delta Lat-Long-Height 3D Positional Plot
This chart displays a three dimensional delta X-Y-Z scatter display of positions about the provided base station’s location. It represents the delta variant of the above chart. Units of centimeters are used. The Height of each point is used to determine the color highlight used for that point. The viewing angle (pitch and yaw) can be adjusted with the five rotational controls. The “R” (for reset) control resets the display to the starting rotation and elevation angles. The current angle is displayed in the upper left corner.
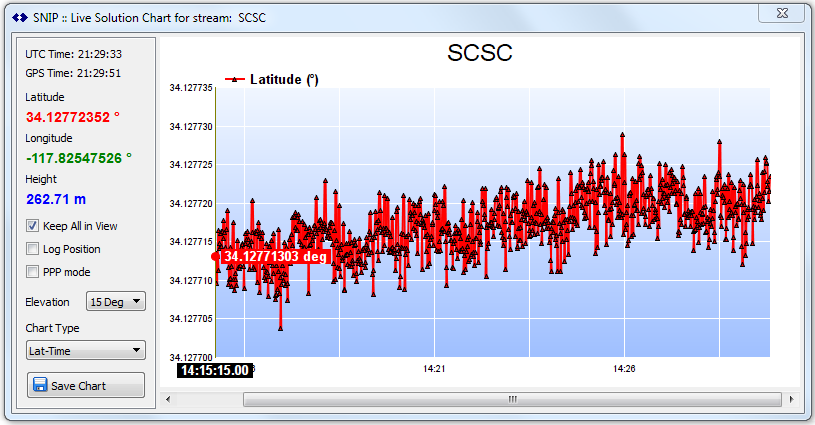
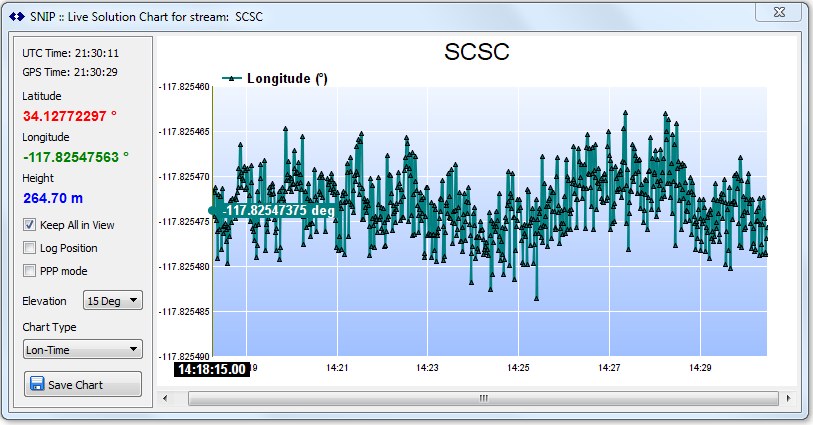
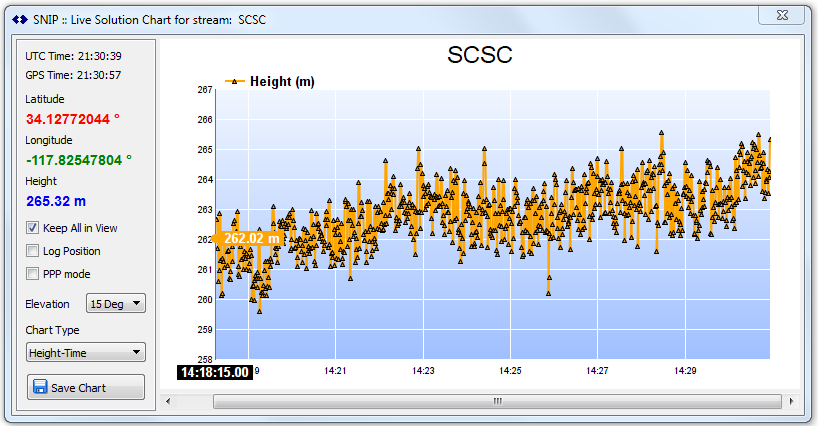
Latitude, Longitude, or Height vs Time
These charts display the single selected value of either Latitude, Longitude or Height at a given time over the past 900 measurements (15 minutes). Units of degrees are used. The mouse roller ball can be used, along with the horizontal scroll bar to pan and zoom the displayed data set.
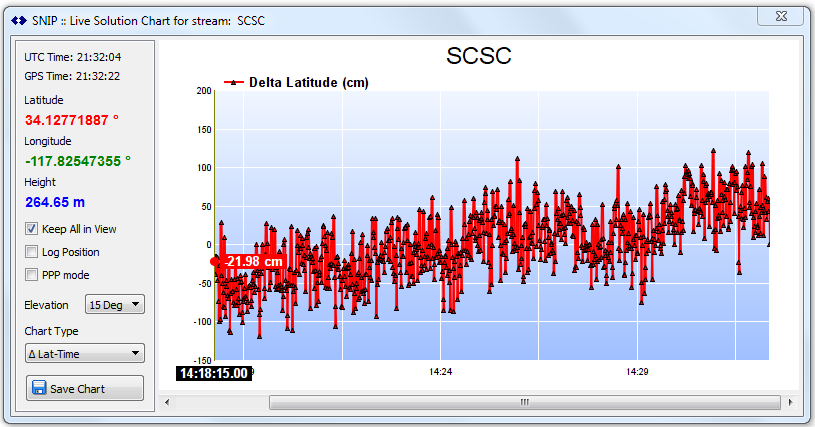
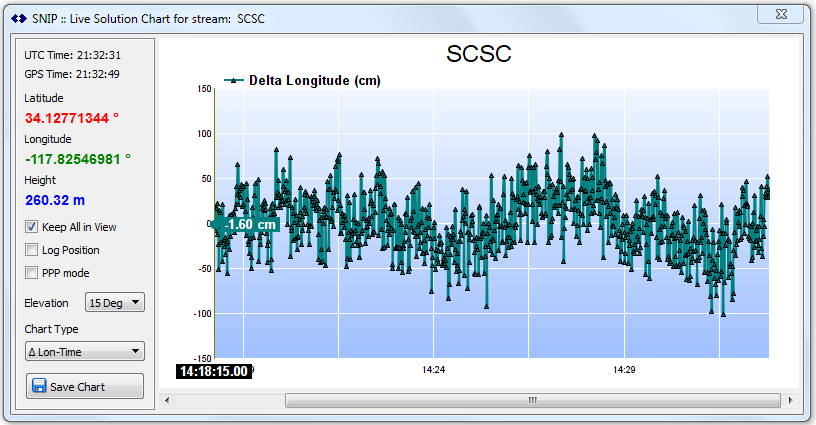
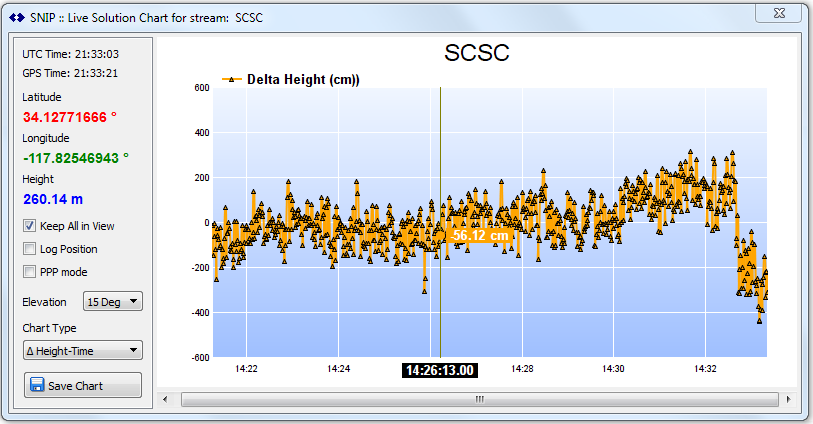
Delta Latitude, Longitude, or Height vs Time
These charts display the single selected value of either delta Latitude, delta Longitude or delta Height at a given time over the past 900 measurements (15 minutes). They represent the delta variant of the above charts. Units of centimeters are used. The mouse roller ball can be used, along with the horizontal scroll bar to pan and zoom the displayed data set.
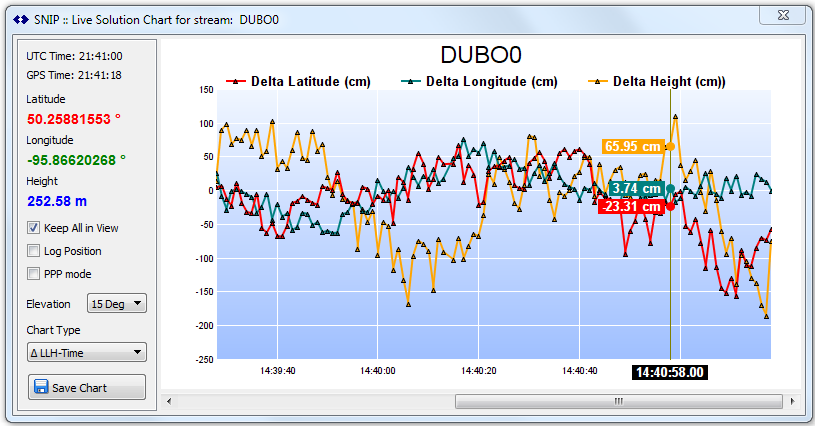
Delta Combined Lat-Long-Height vs Time
The chart displays the combined values of delta Latitude, delta Longitude or delta Height on one chart at a given time over the past 900 measurements (15 minutes). There is not a similar non-delta chart as the span of data ranges make such a chart of no value. Units of centimeters are used. The mouse roller ball can be used, along with the horizontal scroll bar to pan and zoom the displayed data set.
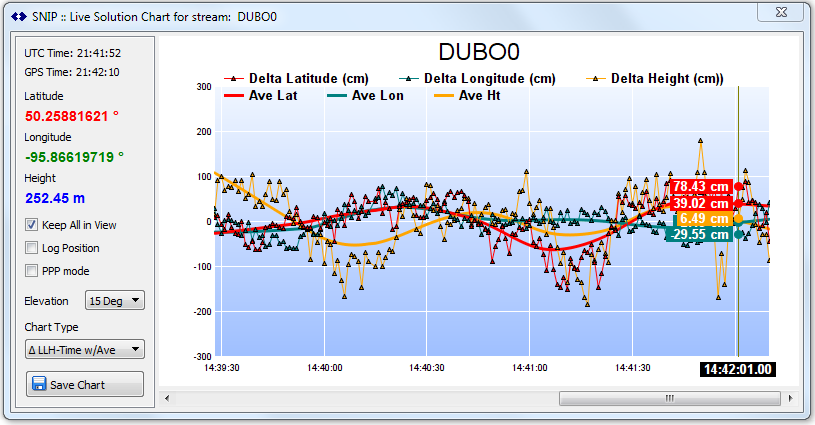
Delta Combined Lat-Long-Height – With An Average vs Time
The chart displays the combined values of delta Latitude, delta Longitude or delta Height on one chart at a given time over the past 900 measurements (15 minutes). In addition, a simple spline curve is fitted to each value set and plotted to show the short-term trending of the data set. Units of centimeters are used. The mouse roller ball can be used, along with the horizontal scroll bar to pan and zoom the displayed data set.
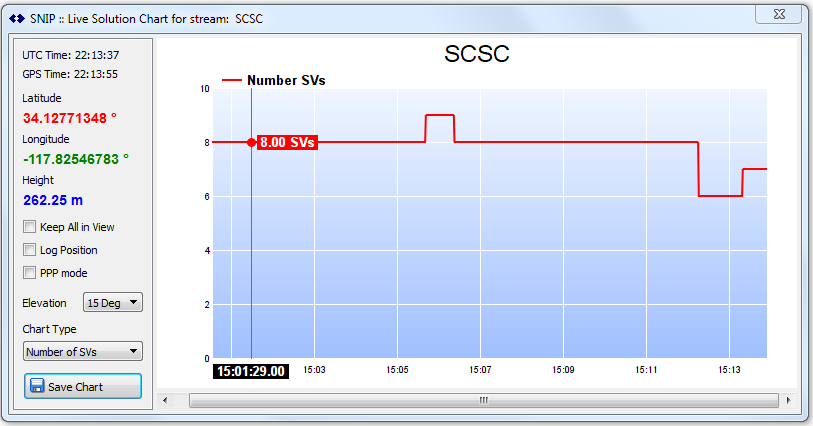
Number of SVs vs Time
This chart displays how many SVs (space vehicles, i.e satellites) are present in the mountPt data stream at a given time over the past 900 measurements (15 minutes). This is the number of SVs used in the solution. Changes in the number of SVs provided by the base station are often correlated with disruptions and changes in the navigation solutions of the rover devices.
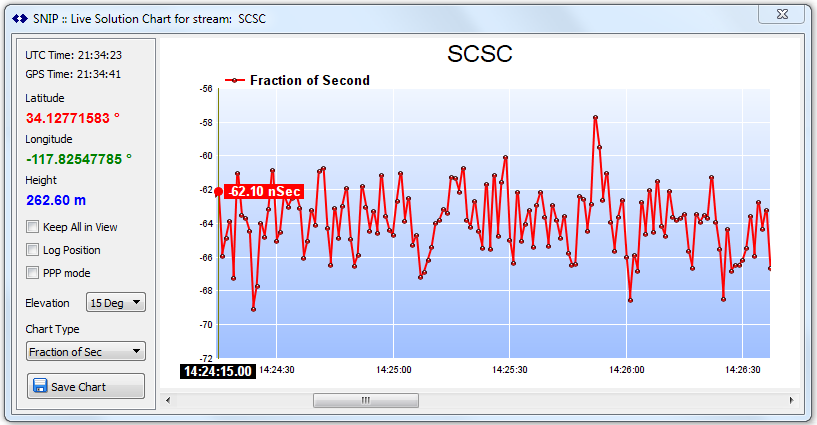
Fraction of Second vs Time
This chart displays the current time estimate offset in the navigation filter at a given time over the past 900 measurements (15 minutes). Units of nanoseconds are used.
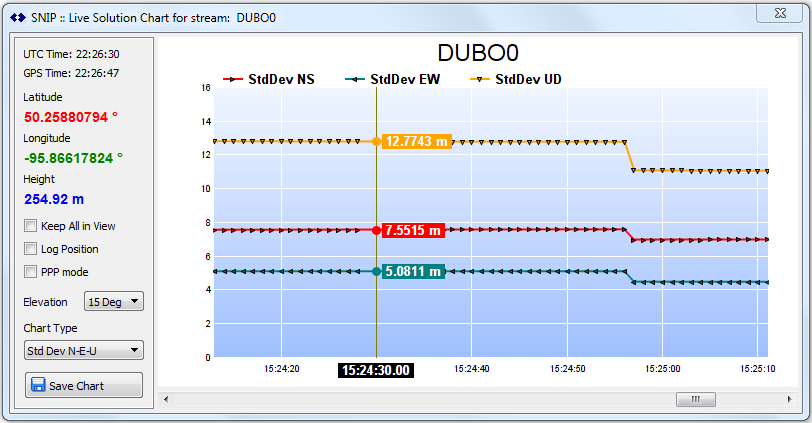
Standard Deviations N-S, E-W, U-D vs Time
This chart displays the current standard deviations in the navigation filter at a given time over the past 900 measurements (15 minutes). The three orthogonal axes of North-South, East-West and Up-Down are plotted. Units of meters are used.
Plotting the position solution on a base map
And, SNIP also allows plotting the Lat-Long position of the real time navigation filter solution on top of a Base Map showing the Base Station’s reported position. This has two primary benefits. First, it provides a quick and simple, way to recall where a base station is located. Second, it allows a visual indicator that the navigation solution resolves to the same general area the station is reporting – a useful tool to confirm that the base station data is valid. [On the Enterprise editions of SNIP, excessive variations cause real time integrity monitoring alarms to trigger and report as well. This will be made a Plug-in in the pending Rev3 release of SNIP]
With an unaided autonomous least squares filter processing a typical base station, you will observe that the point by point movement varies by perhaps ~50cm and is centered more of less around the correct base station location (subject to daily ionospheric errors). So this tool is best suited to detecting grossly incorrect reported data. It is not a precise RTK filter, please use various tools like RTKLIB for that need. If you are uncertain how to correctly set your own base station location to mm levels of accuracy these articles may be of value to you. One, Two, Three.
Hint: When you have a Base Station that for some reason is not sending MT1005/1006 (the ECEF messages), use the navigation filter to quickly identify the correct location to around ±2 meter. Also, if the reported location markedly differs from the navigation filter location, this likely indicates a data blunder in entering the ECEF location at the Base Station.
Summary
This article has presented the basic navigation style chats provided by SNIP. In general these charts are used to observe the data quality of a single given mountPt stream in real time. Other charting types are used to display administrative details about the SNIP Caster, such as the up/down time of various streams and the number of clients serviced.
These charts are all accessed by right clicking on a stream and selecting the Graphical Views menu item. These reports can also be printed or sent to others by way of the eMail service.
Download your own copy of SNIP today