The the P.F.A.T.™ control system provides several innovative ways to control the messages present in every data stream. The PFAT features are available in the Pro, Basic, editions of SNIP. Lite copies of SNIP share the same code base, but many of these innovative features are disabled in the freely available Lite edition.
Using the PFAT Main Dialog
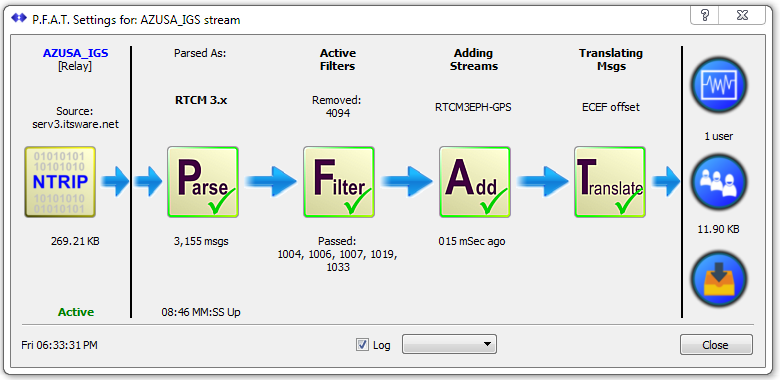
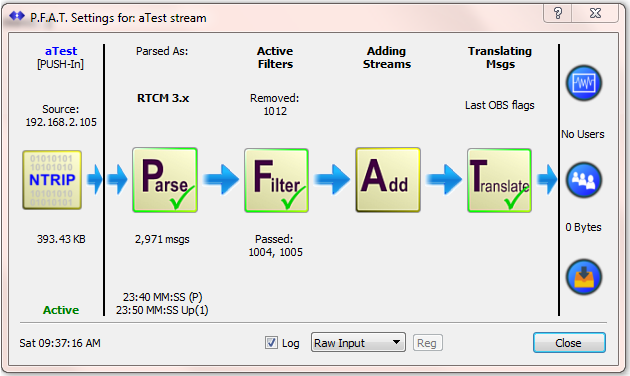
The PFAT controls and their current settings can be easily viewed from the PFAT main dialog, shown below.
This dialog is invoked by right clicking on the context menu for any parsed stream, selecting the PFAT sub-menu, and then the View Settings. This menu item is disabled in streams which are not parsed, or on streams that are undergoing initial analysis.
Note: All of the individual PFAT elements can also be directly invoked by clicking on them in the PFAT sub menu. This is a more direct way to access specific controls.
The above image illustrates a common PFAT use case where the GLONASS observables (raw measurements) have been removed from a stream providing GPS+GLO observables.
The textual labels shown above and below each icon denote a summary of the current state of that PFAT element. Hovering over the various elements in the dialog brings up additional data in tool-tips. Clicking on the icon invokes that PFAT element.
Each of the eight icons in the above image can be clicked on to bring up further dialogs and controls in the PFAT system. These are considered further in this article.
The resulting nesting of several modal dialogs make this the most complex part of the SNIP user interface.
The Input Section
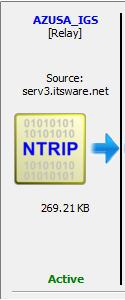 The Input Section is used to display details about this data source including the data stream type and various details about the Base Station. Pressing the icon sends a detailed report about the stream to the console. This information is also available as a tool-tip when hovering over the icon.
A current count of all data read in since the stream was started (or Parsing was re-started) is shown below the icon. The word Analysis is shown during the initial connection and analysis period.
The general state of the connection (Active or Stale Data) is also shown.
The Parse Section
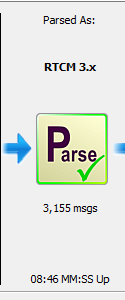 The Parse Section is used to control and display if this data source is being parsed for RTCM 3 message content, or if it is UN-parsed. Pressing the icon toggles the parse state, invoking the auto-parse mode.
A count of all decoded messages since the stream was started (or Parsing was re-started) is shown below the icon. During the initial analysis period, status text is also displayed.
The text at the bottom displays the period of time the stream has been active. If the stream has not be parsed that entire time, the time spent in a parsed mode is also shown.
The Filter Section
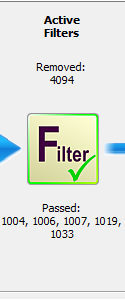 The Filter Section is used to control and display what the current active message filters are (if any). Pressing the icon brings up the Filter dialog.
A list of the message types (MTs) being filtered is shown above the icon. A list of the message types that are not being filtered (are passed on to connected clients) is shown below the icon.
Note: These are the messages which are present in the source stream, additional message contents may be added using the Add ability (see below) and the sum of these is sent to the connected NTRIP Clients.
The Add Section
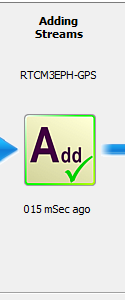 The Add Section is used to control and display adding the message contents of other data stream into this one. Pressing the icon brings up the Add dialog.
A list of the data streams being added is shown above the icon.
The elapsed time from when the last data stream was added is shown below the icon. This time will vary based on how often each added stream transmits messages.
The Translate Section
![]() The Translate Section is used to control and display a variety of translation operations that can be invoked on the stream. Pressing the icon brings up the master Translation dialog. Individual Translation functions can then be invoked from there.
The Translate Section is used to control and display a variety of translation operations that can be invoked on the stream. Pressing the icon brings up the master Translation dialog. Individual Translation functions can then be invoked from there.
A list of the active translations is shown above the icon. If needed, this list is continued below the icon as well.
Whenever a data stream is being operated in “bent pipe” mode (that is; no parsing is being done and all input is sent to clients as output with no changes), this state is displayed in textual areas.
The Output Sections
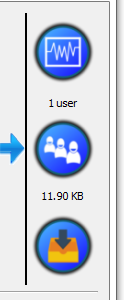 The Output Section is used to display details about the NTRIP Client users of this data stream. It also provides access to reports and to quickly run various navigation filters on the data stream.
A count of current and historical users is shown above the icon. A sum of all data sent to users from this stream is shown below the icon. Pressing on the Users icon produces a console log report about these users.
Note: The right click stream context menu supports this ability, as well as the additional ability to plot each connected user on a common map when there is NMEA data for that user.
Pressing on the Monitor icon is used to start any of the various navigation filters on this stream. Pressing the Report icon sends a simple report about the Base Station and its precise ECEF / LLH location to the console.
Below these section is a Log control which indicates at what point in the PFAT process data will be logged to a file (if enabled). Data can be logged before (raw input) or after the PFAT process.
Putting this together, the PFAT main dialog provides a common place to view all of the current setting for a data steam in one place.