This article covers the SNIP and Host machine sections of the automatic error reporting in greater detail. Instructions regarding how to set the trigger thresholds for the needs for your Caster are provided below. The SNIP NTRIP Caster provides a range of automatic error reporting mechanisms to alert both the Caster Owner/Operator and the NTRIP Clients when various detrimental operating conditions occur. A higher level overview of these functional sections is provided in this article.
Overview
The logic involved in this section deals primarily with SNIP itself and the machine on which it is hosted, rather than the Base Stations and the User Accounts which connect to it for corrections. The raw data which is used in trigger thresholds is gathered as part of the routine system logs and can be plotted over various time intervals ranging from hours to weeks. [See this article for further details on this topic.] Many of the items which are tracked here evolve over periods of many hours or days due to other resource demands on the host machine.
This section of the dialog consists of seven related logic areas highlighted below.
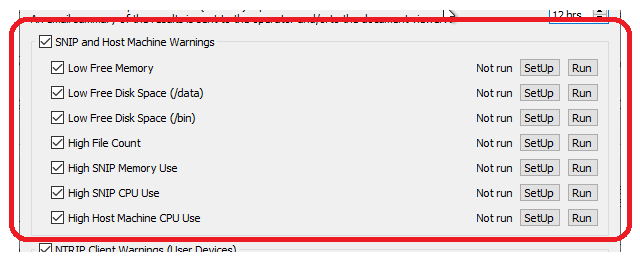
Each functional area can be enabled / disabled by checking / unchecking the associated check box. Each SetUp button brings up a control dialog where the behavior of that function can be set. For this group of error functions the setup process controls value limits which must be exceeded before a warning eMail is sent out. The Run button causes the logic of the associated function to be run and a summary report to be created. The Run Now button (at the bottom of the dialog) can be used to process all the active functions and send a report.
Each functional area is discussed in turn.
Low Free Memory
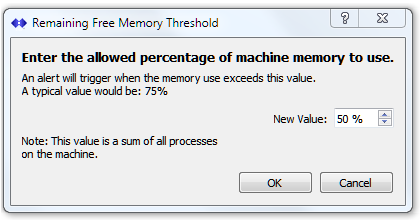
This test checks the current available free memory on the host machine and reports if it is below the threshold set. This reflects the memory used by all processes and applications on the host machine, not just SNIP. When the host machine is running low on memory, performance suffers and can cause SNIP to crash if it is unable to allocate memory it needs. Unlike many desktop applications, SNIP is constantly servicing data between users and bases. In an NTRIP Caster there is no concept of swapping out large sections of the program during idle times as might be found (for example) in a word processor. Generally SNIP memory use is constant and proportional to the number of Bases connected (various logs grow over the first week of operation). But SNIP will (temporarily) allocate more memory whenever the user requests large reports, or maps, or loads prior weeks logs, and when other periodic processes must run as background tasks.
See also: High SNIP Memory Use (below) which measures the memory being used by SNIP itself.
Low Free Disk Space, for Data
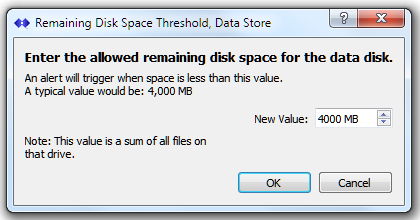
This test checks the current available free disk space on the host machine, using the location where SNIP /data is being stored. The /data folder location is used to store larger files (typically raw observational data from Base Stations can then be processed into RINEX for further use). You can control where the /data folder is located with the Log Settings dialog, reached with the menu item Misc ⇒ Data File Settings… It is common to use a secondary drive to store Base Station data for ease in backing up such files. When the host machine is running low on disk space, GNSS data measurement files may be lost and this can cause SNIP to crash in extreme cases. Under such conditions, SNIP will continue to service the NTRIP Clients but logging (which also requires disk space) is curtailed.
A note for common AWS VM installations: In the most common AWS deployments (various EC2 medium instances) you will have only one hard drive present with no other external storage. A 30G sized drive is common. In such a deployment the two tests “Low Free Disk Space, for Data” and “Low Free Disk Space, for SNIP /bin files” are measuring the same drive.
Low Free Disk Space, for SNIP /bin files
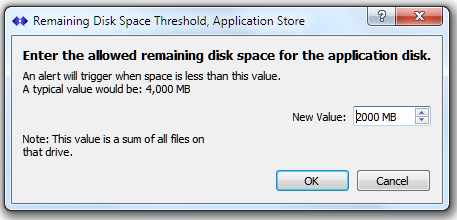
This test checks the current available free disk space on the host machine, using the location where the SNIP /bin folder is located. The /bin folder is where the actual SNIP application and associated files reside. It is also used to store many parameters and settings used in SNIP operations (this article on creating a Backup provides further details of the various files involved). When the host machine is runs out of disk space in the /bin folder it will likely cause SNIP to crash.
A note for common AWS VM installations: In the most common AWS deployments (various EC2 medium instances) you will have only one hard drive present with no other external storage. A 30G sized drive is common. In such a deployment the two tests “Low Free Disk Space, for Data” and “Low Free Disk Space, for SNIP /bin files” are measuring the same drive.
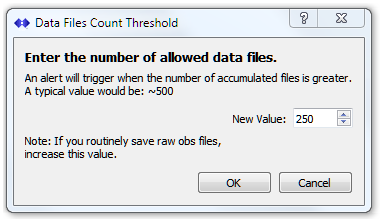
High File Counts
This test checks the number of SNIP related data files which are present on the host machine, in the location (both folder and subfolders) where SNIP /data is being stored. Over time the number of files can become quite large and this in turn slows down the file system and may (especially for virtual machine deployments) cause storage issues. If your host machine has limited disk space, setting this to a low value can be helpful to remind you to periodically clear off older files.
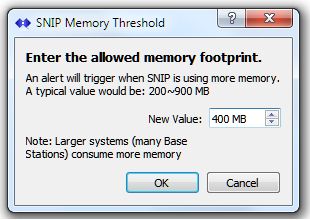
High SNIP Memory Use
This test checks the current memory consumed by the SNIP application on the host machine and reports if it is above the detection threshold set. Generally SNIP memory use is constant and proportional to the number of Bases connected (various logs grow over the first week of operation). Memory use will be observed to grow most rapidly during the first 24 hours after a restart as various buffers reach their allocated sizes. But SNIP will (temporarily) allocate more memory whenever the user requests large reports or maps and when other periodic processes must run as background tasks. [Aside: You can also use the Process command to check on current memory usage.]
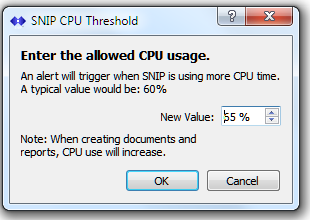
High SNIP CPU Use
This test checks the current CPU processing load used by the SNIP application on the host machine and reports if it is above the detection threshold set. Except for periodic report generation (which occurs most often at intervals of 4,12, and 24 hours), the CPU use on given SNIP deployment is fairly constant. This test is primary used is to detect and report when some additional new demand (often from excessive number of bad user connections) is occurring to the SNIP Caster which requires operator assessment.
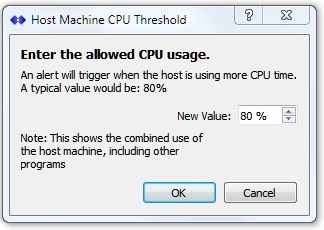
High Host Machine CPU Use
This test checks the current CPU processing load used by the ALL applications on the host machine and reports if it is above the detection threshold set. Its primary use is to detect and report when another application on the host machine may be consuming resources that SNIP needs for efficient Caster operations.
A typical Example of use
Consider a SNIP deployment which is not on a dedicated machine. This machine is at times used for other purposes. When this occurs, the other running applications consume process resources. When suitable thresholds have been set, the SNIP operator can be informed whenever conditions detrimental to the Caster exist.
Consider the chart below (click to enlarge) showing the average CPU use on the host machine. SNIP itself is consuming a trivial ~0.4% of the machine, while the total of all processes (including SNIP) is ~4.3%. This is typical of a machine with only a few active Base Stations and users. At around the time 8:33 the CPU usage increased dramatically. At one point it reached over 80% utilization. [For the purpose of this example, some video clips were loaded and displayed on this machine.] This continues until about 8:44 when the CPU load is reduced to around 16% where it remained for some time. [The video clips were no longer being played but were still consuming memory.]
This condition would be detected and reported by setting the High SNIP CPU Use or by the High Host Machine CPU Use thresholds. [One could set either of both, and each at their own trigger threshold.]
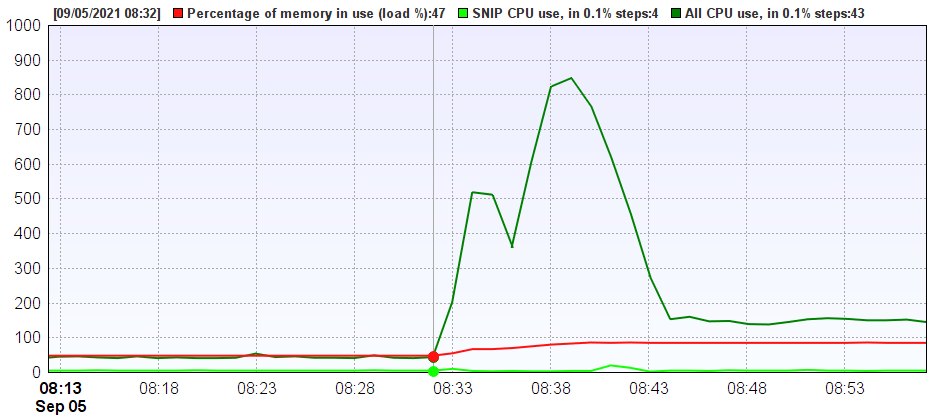
At first glance the above condition may seem transitory. After all, in about ten minutes the CPU use dropped and a considerable spare margin remained for use by SNIP and other applications. But this is considering only the CPU load which was involved. Often the memory utilization gives a better insight. [And this is why the System Logs dialog supports displaying a wide variety of parameters including virtual memory footprints.]
Below we show the same event, but plotted for the memory footprint used (and displayed over a longer time scale). After the initial moment of increased CPU use we see overall memory on the host machine rise from an original values of ~47% to well over 85% of all memory now being used. At this point there is little free memory left for SNIP to run large report requests or other periodic tasks. Note that this condition persists AFTER the time when CPU use is reduced (at ~8:44) to about 9:05 when the application in question was terminated.
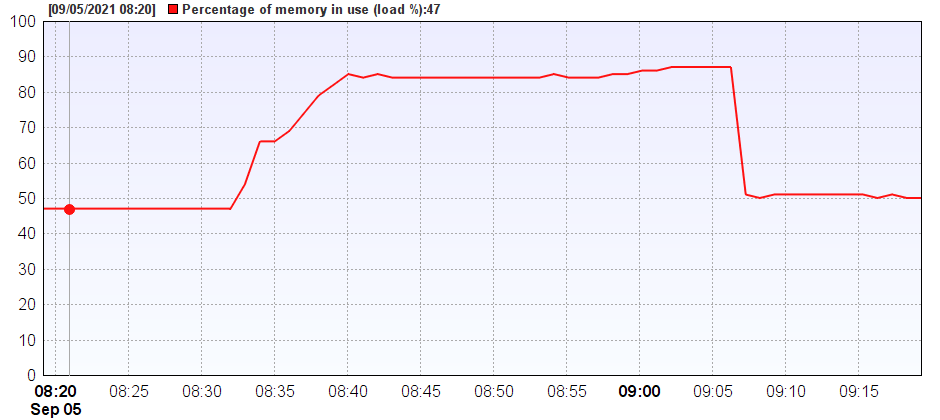
This condition would be detected and reported by setting the Low Free Memory threshold.
When one or more conditions have been detected, the eMail report issued lists them along with both the current value and the threshold value. The key fragment of this report is a table which is shown below. This table is for another machine where SNIP itself has grown the a large size (a AWS VM deployment which has many Stations).
| Test For | Result |
|---|---|
| Host Machine Low on Memory | 71% In use. (85%), Within normal bounds |
| Data Store Disk Space | 5,083 MB remains. (1,500 MB), Within normal bounds |
| Application Disk Space | 5,083 MB remains. (1,500 MB), Within normal bounds |
| Data Disk Space File Count | 157 files. (200), Within normal bounds |
| SNIP Application, Private Memory use | 770 MB. Warning! Large Memory Use. (750 MB) |
| SNIP Application, CPU use | 20.7% Used. (40.0%), Within normal bounds |
| Host Machine, CPU use | 25.4% Used. (40.0%), Within normal bounds |
The above shows (among other things) that the subject machine is using 71% of its memory, which is still below the trigger point of 85% but that the memory size of SNIP itself has grown to be 770MB, which is 20MB beyond its allowed size.
Hint: Recall that the checkbox No send if all are normal can be used to disable sending status reports when every enabled category is within its normal bounds. This is useful to reduce unwanted eMail traffic.