This article provides an overview of the system logging features found in SNIP. The logging process collects “counts” of various performance metrics as the Caster operates. These are then reported graphically over time periods spanning from minutes, to weeks, or years in duration. The data gathering and binning process is an automatic background task, and SNIP allows the operator to easily view and pan over up selected periods of time to examine past performance.
This functionality is most often used to monitor Caster operations over a preceding period of interest (prior day, week, etc.) The graphical reports can be saved as a file (PNG, JPG, PDF, etc.) , or printed or eMailed for use by others. The various system logs are presented in common dialog box described further below.
This utility can be opened with the menu command: Reports ⇒ System Logs…
Example of Use
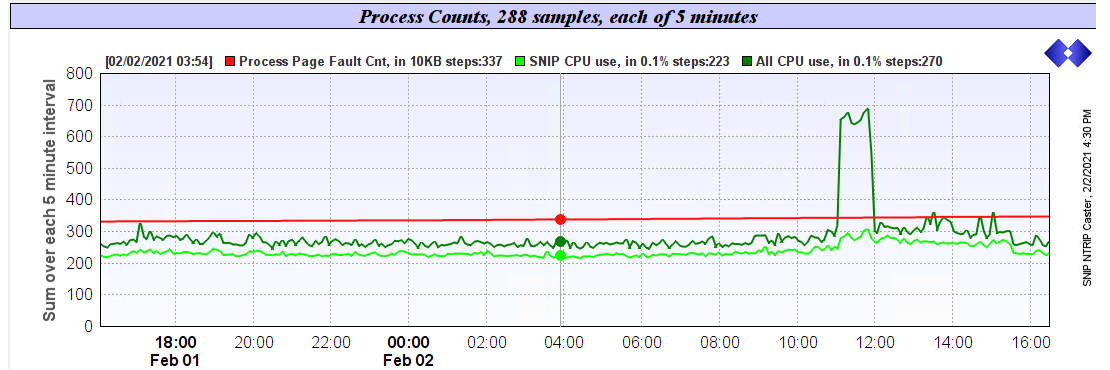
Below is a typical plot showing the host machine CPU utilization over a span of 24 hours. In this image the SNIP process is utilizing about 22% of the available MIPS while the overall host machine is about 33%. Except for a noticeable short burst when the machine processing load increased to ~68% the machine is not being stressed. This increase was attributable to a system backup process running at the time.
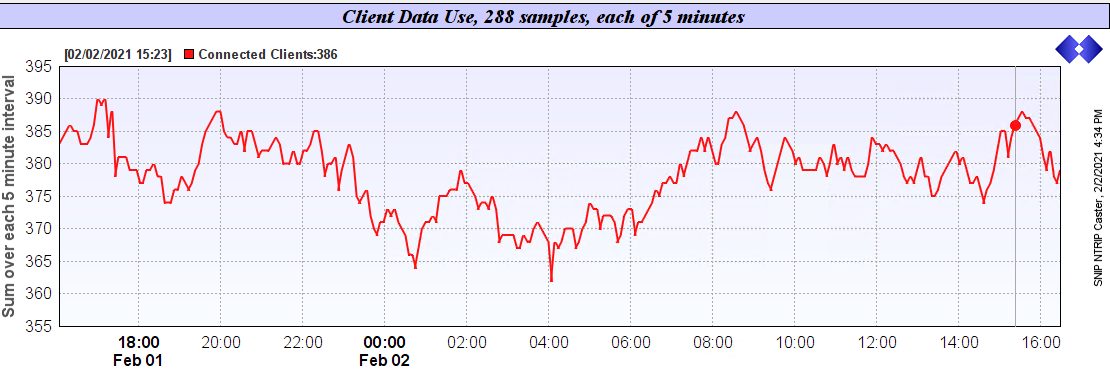
For a greater sense of context, here is a plot of the connected users (NTRIP Clients) being served corrections over the same 24 hour period. This Caster is hosted on a shared 2-core AWS virtual machine, a low-cost configuration commonly used to host SNIP NTRIP Casters.
Time Spans Control
The dialog presents the user with a drop-down combo which controls the span of time presented, as well as the ‘bins’ of time over which the performance counts are collected. The selected span of time can be moved from four hours (with data collected over one minute periods) to as much as three years (with weekly collection periods). Spans include: 4 hours, 24 hours, 72 hours (3 days), 1 week (7 days), 2 weeks (14 days), 1 month (31 days), 1 year, and 3 years in duration. If a span of time is selected for which there is no data yet, the display states this (this occurs with new SNIP deployments which have not yet run very long). [Click to enlarge any image]
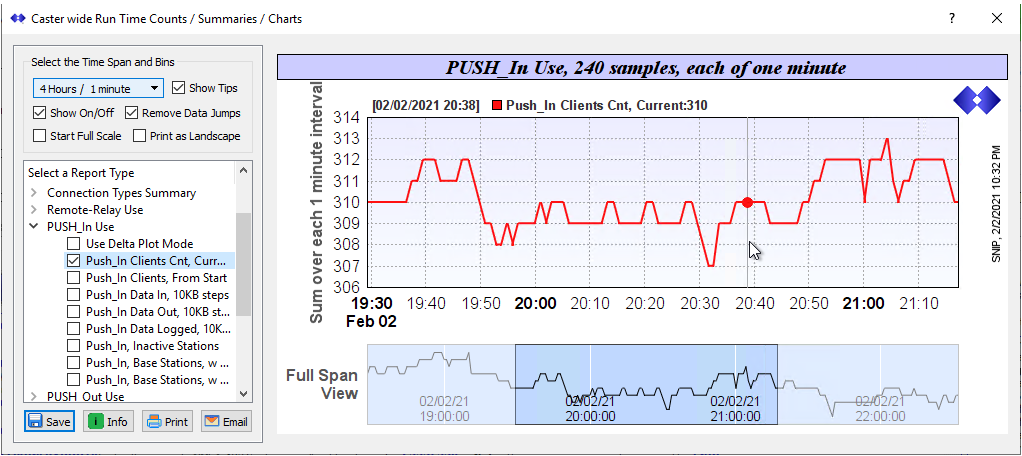
The plotted data is shown in a dual view mode. The currently selected chart (the upper image in the above) displays the span of time the user has selected with mouse movements. The display defaults to the last 20% of the time when first shown. [Hint: Drag the mouse over the image to scroll and pan, use the roller button to control zooming] The lower chart displays the full span of data and shows the current chart in displayed perspective over the full set of data.
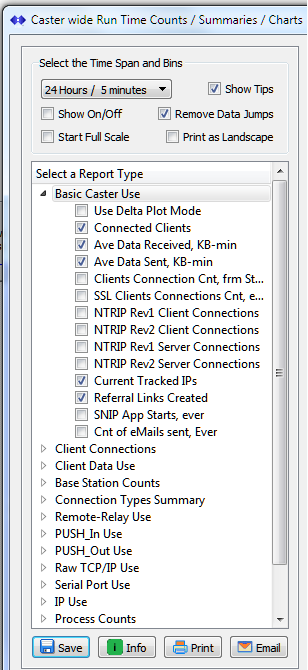
You can control the specific set of data that is plotted by checking and unchecking the list of data items shown in the the tree view on the left side of the dialog for each chart. The chart will auto-scale the vertical axis as required to display the selected data. Each chart type presents a collection of possible data items with the most commonly used items selected. Tool tips (hover over a given data item) provide additional information. When hovering over the chart, the tool tips display additional data about that data point and the legend at the top displays the precise time and values for the currently selected data point displayed item.
Controls
Some additional remarks about the controls follow below.
Checkboxes
Show Tips; Disable to remove tool tips in the chart. For very large and complex charts this provides a slight time saving when rendering.
Show On/Off; Displays a vertical line and the data/time in the chart whenever the SNIP Caster was taken off line. Useful to see when the trends in displayed data was disrupted by the Caster being offline.
Remove Data Jumps; Applies a moving low pass filter to the each displayed data to remove corruptions that can occur due to bursts of data at the edge of the sampling (‘bin’) interval.
Start Full Scale; When checked the display starts with the full span of data displayed. When UN-checked the last (most current) 20% of the data is displayed. The operator can also easily scale and pan the display using the mouse.
Print as Landscape; Makes the default printing style a landscape mode. The user can also change this in the print dialog.
The Report Type Tree
Provides a tree style list for each report. Select a report (click on it) to display it. The children items for that entry will open as well. Each report has a collection of related data items to select from.
The possible data items to be shown are shown as children in the tree. Only those items with a check mark are charted. The default items when the dialog is first presented reflect reasonable choices about what is most commonly of interest. Less common data items are included in the list but not selected. The operator selections made are remembered when changing to other charts. This is to promote the ability to compare different chart types. The default settings are renewed each time the dialog is started. The magnitude of the selected item can vary widely. (This typically depends on the nature of your Caster. For example, some Casters have hundred of different users or IP connections, while others may have a very small user set.) Simply deselect any ‘large’ values to re-scale and expose smaller ones when needed.
One check box in each report type bears additional discussion. The Use Delta Plot Mode box enables (when checked) a delta plot style where the difference between the current value and the last value is plotted. This is useful when seeking to find and display any disjoint events and trends in the data.
The buttons Save, Info, Print and eMail perform the normal functions.
Chart Types
The following charts can be selected.
Base Caster Use
Displays basic Caster information including average data served and client counts.
Client Connections
Displays details about the number of clients serviced and their types (Rev1/Rev2, NTRIP Clients vs Servers)
Client Data User
Counts of the numbers of data served, tables served, web page served, etc.
Base Station Counts
Counts of the number of Base Stations present of each connection type (Remote-Relay, PUSH-In, PUSH_Out, Raw TCP/IP, Serial).
Connection Types Summary
Counts of the total bytes served out by each connection type (Remote-Relay, PUSH-In, PUSH_Out, Raw TCP/IP, Serial).
Remote-Relay Use
Displays service details about the Bases and User Accounts connecting with Remote-Relay connections.
PUSH_In Use
Displays service details about the Bases and User Accounts connecting with PUSH_In connections.
PUSH_Out Use
Displays service details about the Bases sending out data to remote sites with PUSH_Out connections.
Raw TCP/IP Use
Displays service details about the Bases and User Accounts connecting with RAW TCP/IP connections.
Serial Port Use
Displays service details about the Bases and User Accounts connecting with Serial UART connections.
IP Use
Displays further details about the range and diversity of the different IPs which have connected to the Caster.
Process Counts
Displays details about the SNIP application process (CPU use, memory use, etc.) and about the host machine it is running on.
Offline Base Stations
Displays details about any Base Stations which are offline or otherwise reporting persistent connection issues.