 This article describes the contents of the User Report which the Web API provides. SNIP allows requesting this report remotely with any browser by authorized users. An active Web API Plug-in is required for this feature. First Login from an authorized account with either read-write privileges, or with read-only privileges. If you use an account with only read-only privileges, some of the information shown is reduced. [Click to enlarge the image]
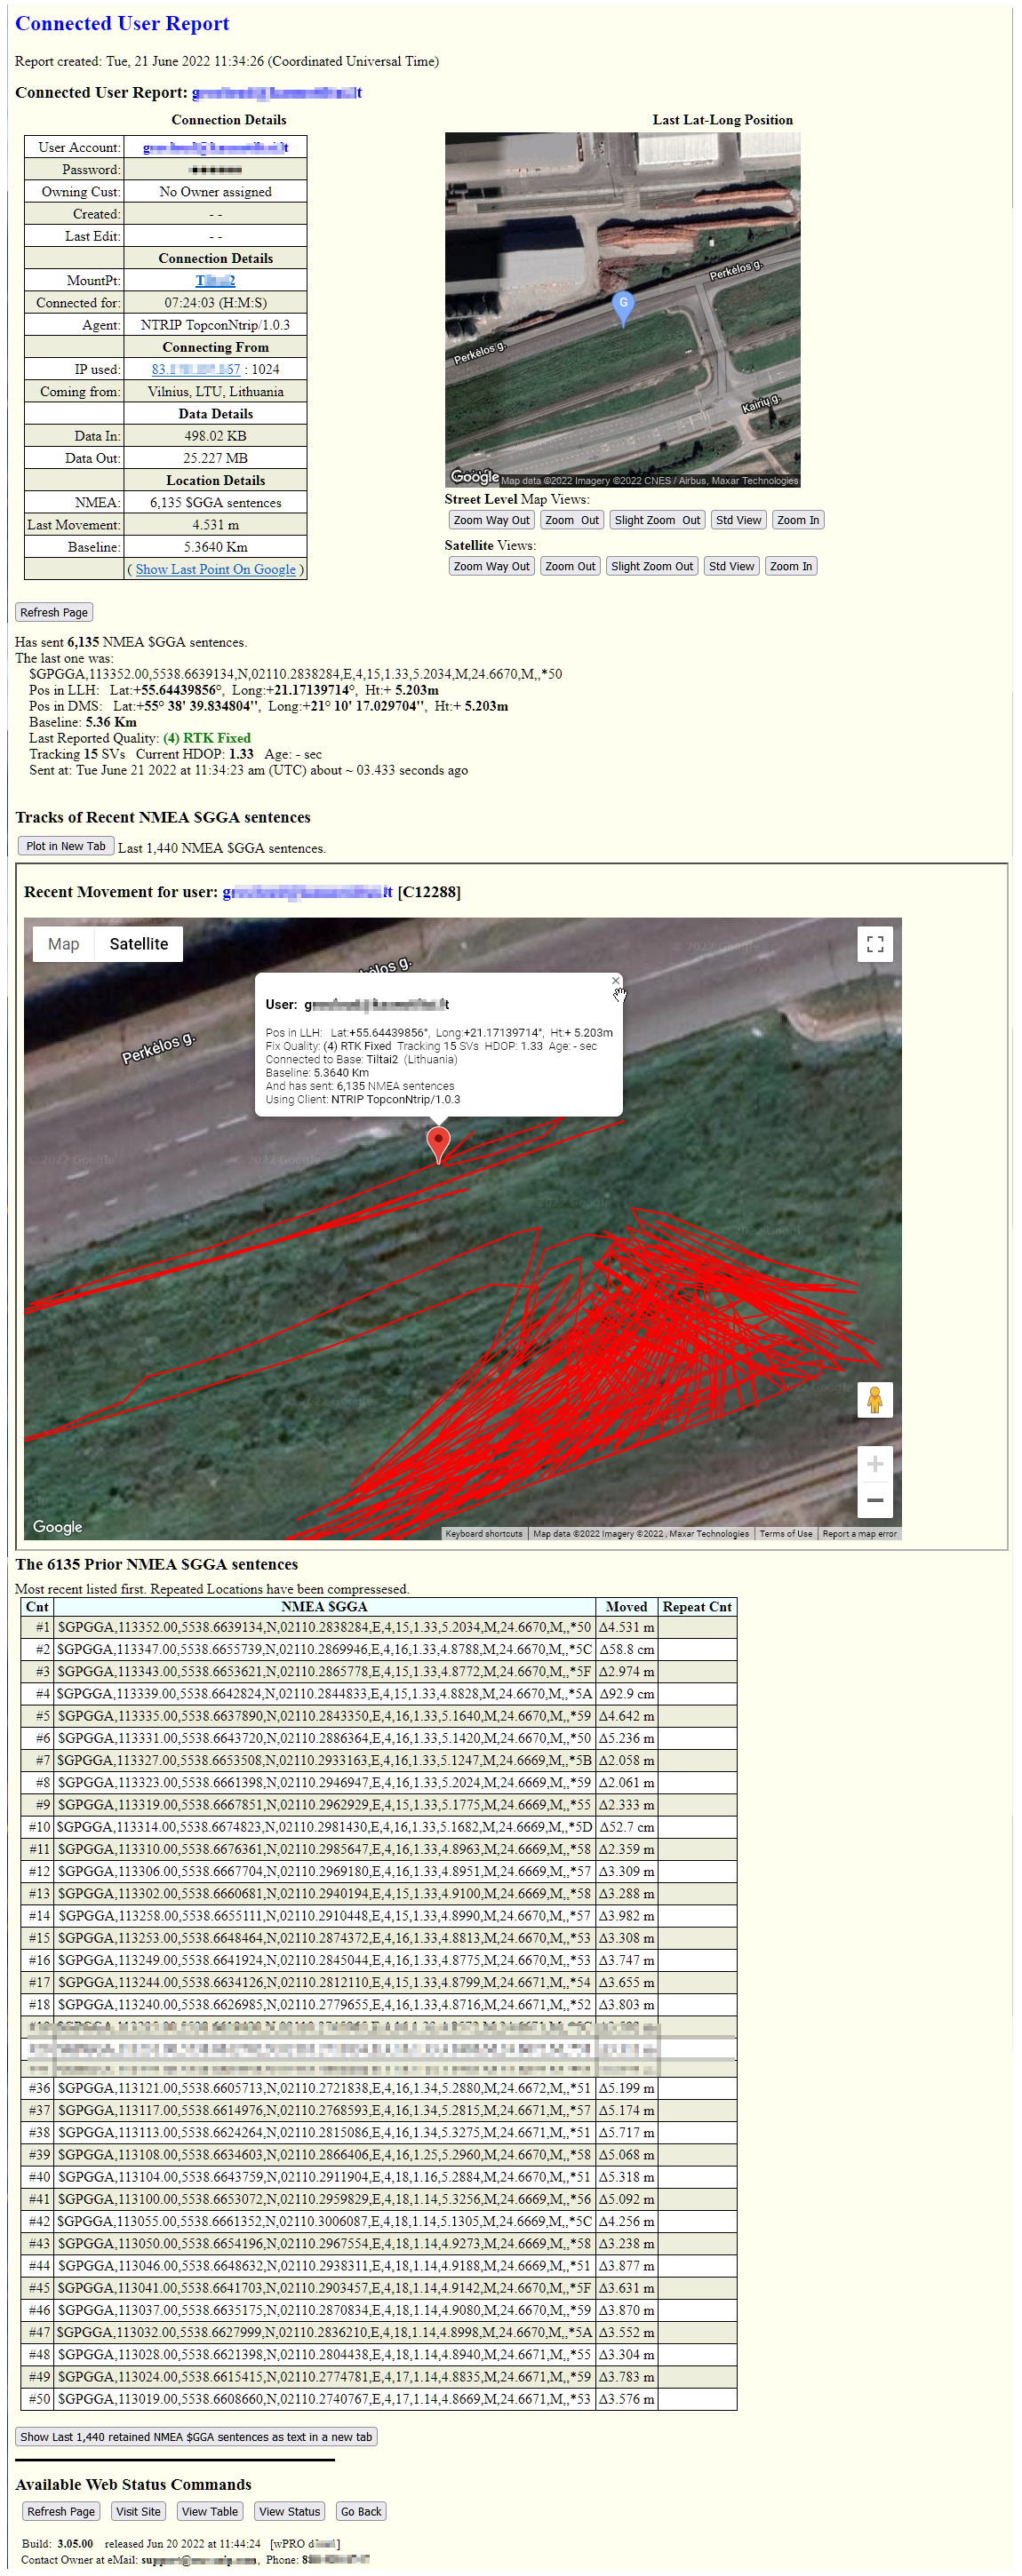
You reach the User Report by traversing from the Web Top Page to the table of current user connections. You then click on the user of interest to open the report.
The User Report consists of five major sections. Each is reviewed in turn. If the user connection provides no location information, the last three sections are not shown.
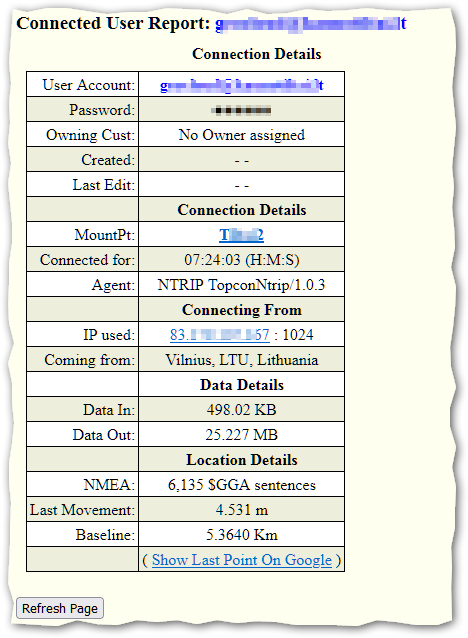
User Details
The first section of the report contain a table of key values for the user connection (along the left side). The user account name and the Base they are connected to are shown. The IP by which the user connects is also shown. Links are provided to these to see other reports. The gross location of the user (City/Region/Country) is also shown when known (this uses a reverse Geo lookup process). Various details about the connection and the data exchanged are also shown. The button Show Last Point on Google produces a map in its own web page which you can pan and zoom when pressed.
Last Location
The second section (along the right side) shows the last reported position of the User on a small map. The buttons below the map allow selecting five different preset levels of zoom and if the underlying base map will be a road map or an image (as is shown here). The default initial map style can be set in the Preferences dialog.
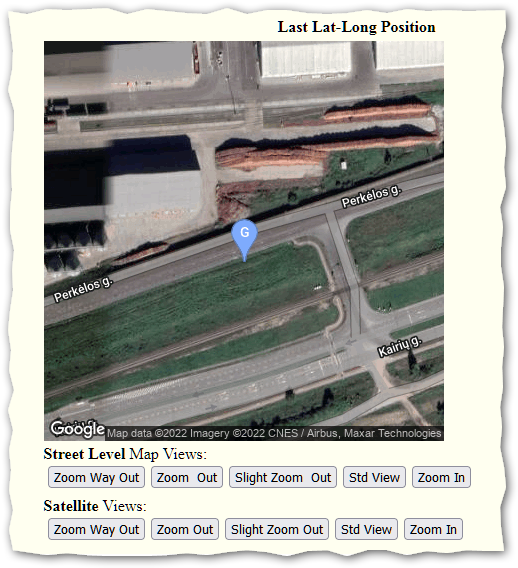
Last NMEA
The third section shows a summary of recent NMEA $GGA data including the reported RTK fix mode. The NMEA lat-long format of DDMM.mmmm is displayed in other common formats. The baseline to the current base is shown. And details about the navigation solution reported by the device are also shown.
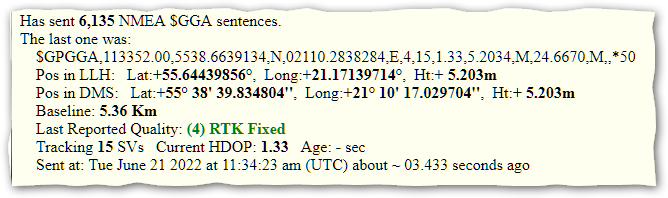
Recent Movements
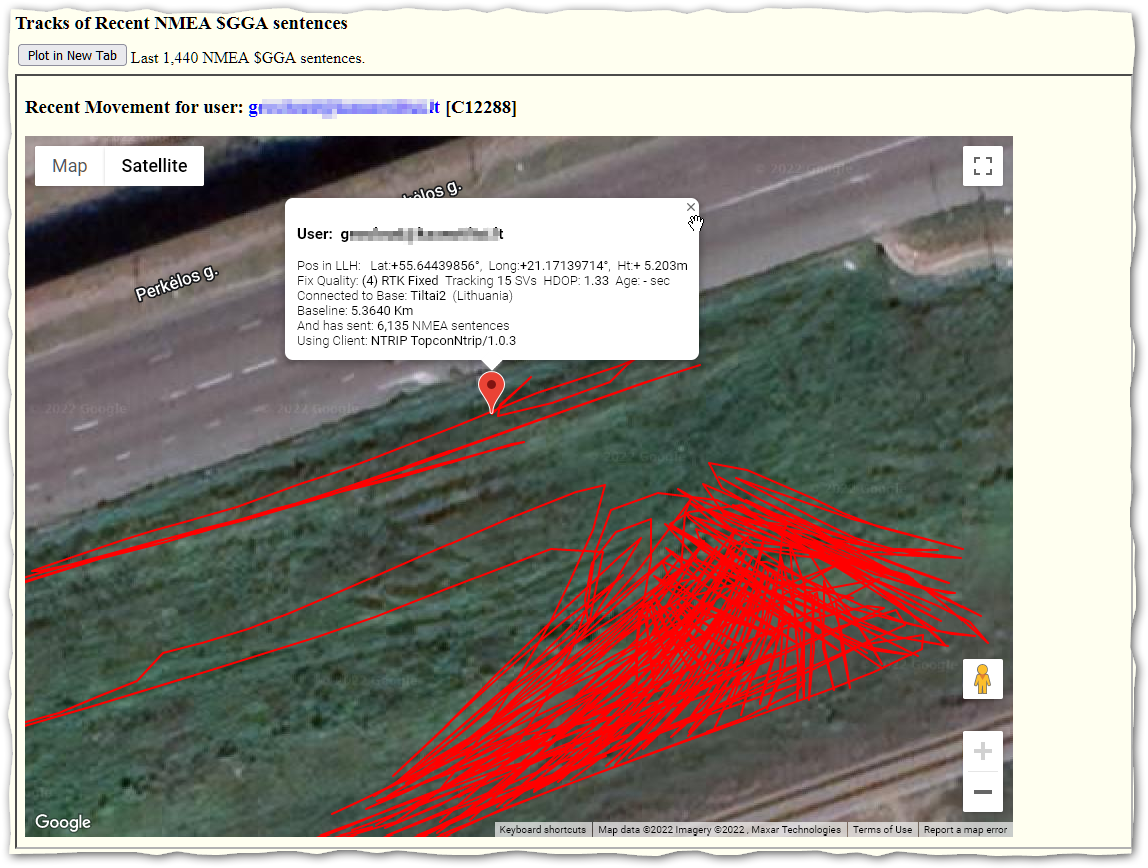
Next, section four shows a plot of recent movements (if any). In this case the user is engaged in some earth moving work in the median of a street. By clicking on the icon, a tool-tip with additional information is shown. By pressing the button Plot in New Tab this image will be shown in its own web page. The Refresh button (above) updates the display with any new information.
Past NMEA $GGA Sentences
Section five concludes the report with a list of recent prior NMEA $GGA sentences and how far each has moved from the prior sentence. If the same location is sent multiple times, SNIP uses a data compression algorithm to keep only the points where some motion is present. A button at the bottom can be used to send this data, in a plain textual form, to a new web page. This is intended to support easy cut-n-paste operations to extract the data for use by other applications that can consume NMEA sentences. 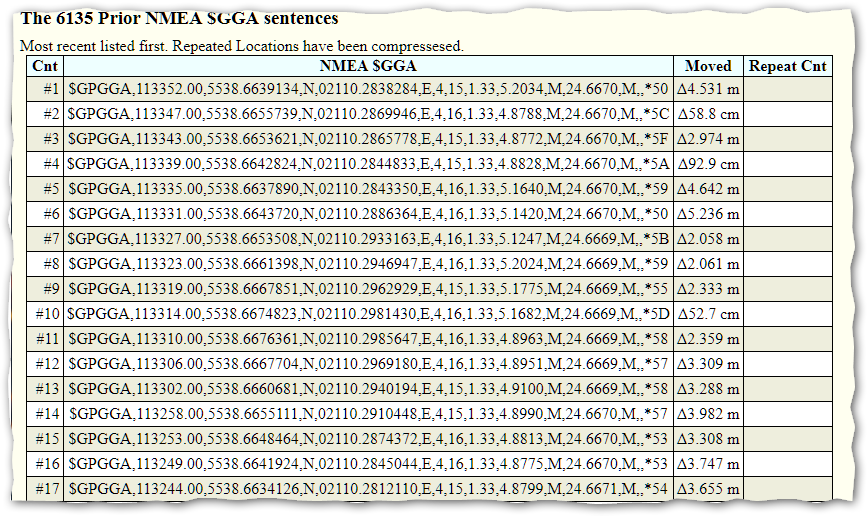
Other ways to reach the User Report include links found in the Base Station Reports and the IPs Reports.